

The preliminary statewide average March temperature was 40.5 degrees, 0.6 degrees below the 1991–2020 average and the 68th coolest on record going back to 1895. The preliminary statewide average total March precipitation was 4.46 inches, 1.24 inches above the 1991–2020 average and the 23rd wettest on record statewide.
Data are provisional and may change slightly over time.
Spring-ish
Outside of a short but intensely cold period in mid-March, last month wasn’t abnormally cool. However, given it followed a top 20 warmest winter on record statewide, March felt to this climatologist as more of an extension of winter than a start to spring. Daily temperature departures from normal in Carbondale show a warmer beginning and end to the month, with a 10-day period of mostly below normal temperatures in the middle (Figure 1). Temperatures between March 12 and 21 were 8 to 15 degrees below normal across the state. Actual temperatures in mid-March dipped as low as 2 degrees in Menard County and 6 degrees in Will County.

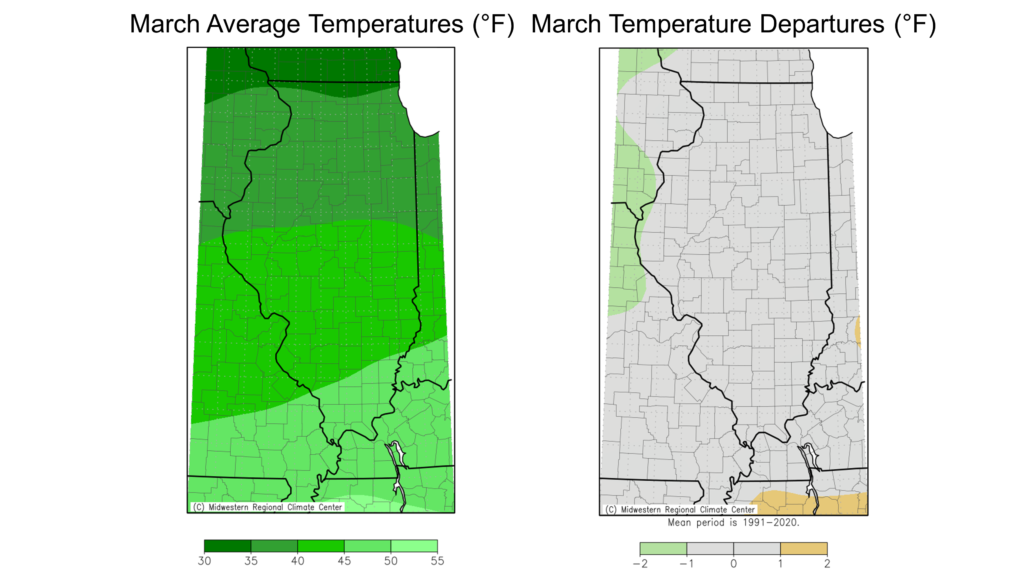
March average temperatures ranged from the low 30s in far northern Illinois to the high 40s in southern Illinois, within 1 degree of normal virtually everywhere (Figure 2). The cooler weather last month broke X daily high maximum temperature records and X high minimum temperature records. Additionally, X daily low maximum temperature records and X daily low minimum temperature records were broken in March.
Overall, the preliminary statewide average March temperature was 40.5 degrees, 0.6 degrees below the 1991–2020 average and the 68th coolest on record going back to 1895.
Wet & Active Start to Spring
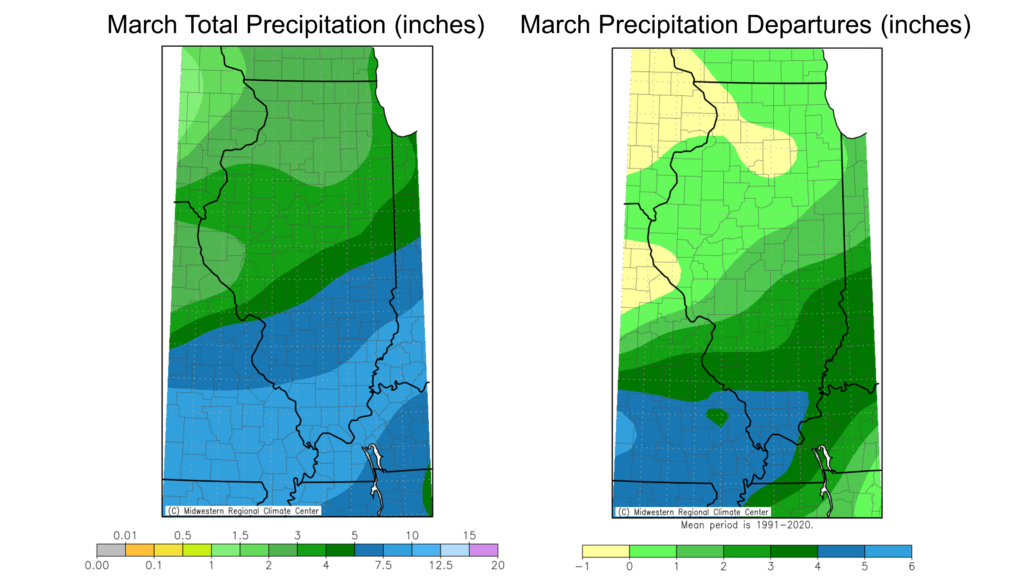
Both January and February were wetter than normal statewide, and March followed the same pattern. Most of last month saw an active storm track and many low-pressure systems running through the Midwest. Most of Illinois remained in the rain portions of these systems, bringing multiple rounds of rainfall–occasionally heavy–to the state. Total March precipitation ranged from just over 3 inches in northwest Illinois to nearly 12 inches in far southern Illinois (Figure 3). While the northern third of the state was around 1 to 2 inches wetter than normal last month, parts of central and southern Illinois were 3 to 6 inches wetter than normal.
Last month was the 5th wettest March on record in Paducah, Kentucky. The first quarter of 2023 has been a top 10 wettest start to the year in Paducah (5th wettest) as well as in Chicago (4th wettest), Rockford (6th wettest), and Peoria (10th wettest). The preliminary statewide average total March precipitation was 4.46 inches, 1.24 inches above the 1991–2020 average and the 23rd wettest on record statewide.
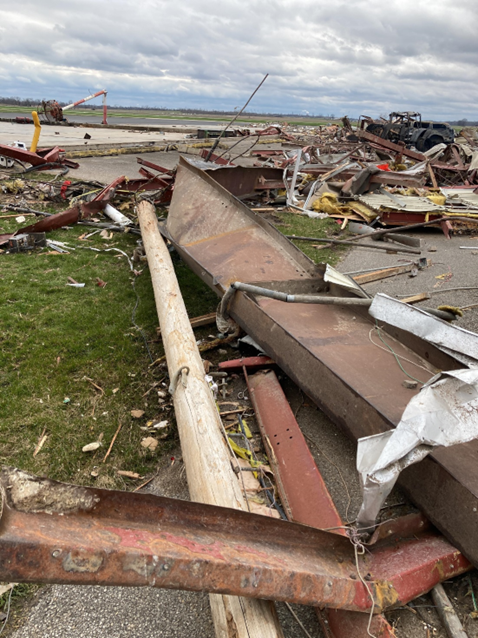
Unfortunately, the frequent precipitation also came along with some severe weather, especially in the last week of the month. A strong system came through the Midwest the final day of the month, producing dozens of tornadoes, hail, and widespread straightline wind gusts exceeding 60 to 70 mph. Significant damage occurred to multiple towns in Illinois that evening, including in Sherman in Sangamon County and Robinson in Crawford County (Figure 4). Among several injuries, three fatalities were reported from the initially rated EF-3 tornado in Crawford County. Additionally, wind gusts exceeding 90 mph were reported in parts of LaSalle and Grundy Counties in northern Illinois and resultant damage reports to buildings and trees. While the exact number of tornadoes on March 31st will be made official later this year, Illinois has likely seen close to the total number of tornadoes it experienced in all of 2022 (37). In fact, through April 1st there have been 200 severe thunderstorm or tornado warnings issued by National Weather Service Offices for Illinois this year, second only to 2006. By this time of the year in 2022, the state had only had 56 severe thunderstorm or tornado warnings
Snow for Thee, Not for Me
Very few folks in Illinois cheer at the sight of late-March snow; however, following the decidedly weak winter we experienced across the state, a stray snow shower would not be amiss in central Illinois. However, as the active storm track carried multiple systems through the Midwest in March, the dividing line between rain and snow seemed locked into northern Illinois. Folks along and north of Interstate 88 saw quickly accumulating wet and heavy snowfall, while areas south mostly got rain.
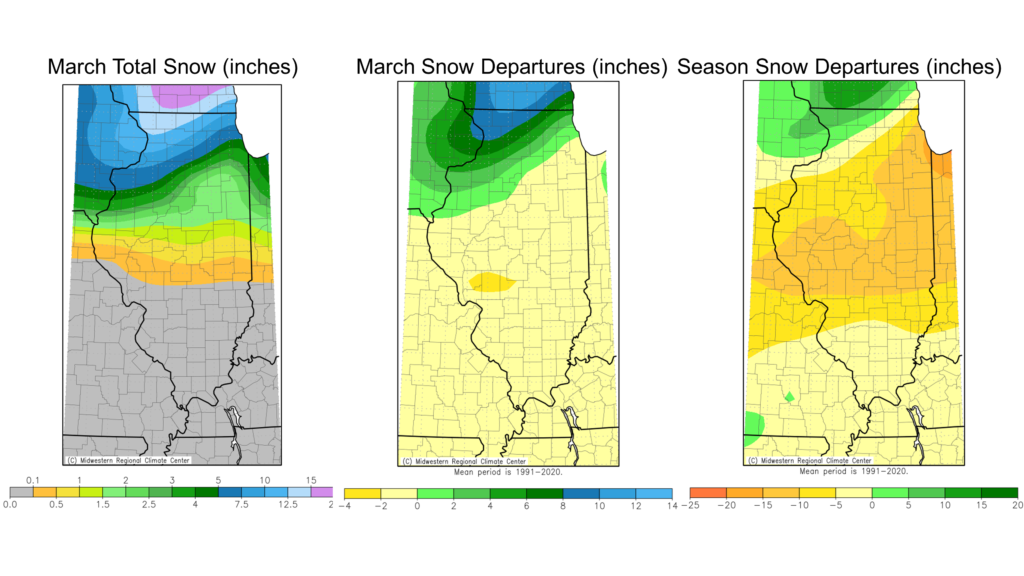
Overall, only the northern half of the state saw any snowfall last month, with totals ranging from less than half an inch along Interstate 70 to nearly 15 inches in northwest Illinois. Moline’s 10.6 inches last month was the most March snow there since 2013.Rockford’s 14.1 inches was the most March snowfall there since 1972. But the big “winner” last month for snowfall was Freeport, with a whopping 14.5 inches, the fifth most March snowfall on record there back to 1943.
As Figure 5 shows, above normal snowfall in March in northwest Illinois has pushed the 2022-23 season-to-date snowfall 2 to 8 inches above normal, while the rest of the state has seen between 2 and 15 inches below normal snowfall this season. The snowfall deficits have been especially large this season in parts of central and northeastern Illinois. For example, if Springfield sees no additional snow before May, it will be the third lowest seasonal total on record (6.3 inches), and the lowest since 1954. It is the same story in Champaign, whose 7 inches so far this season would be the second lowest on record if no additional snowfall is measured before May. Both stations’ records go back to at least the late 1800s.
Outlooks
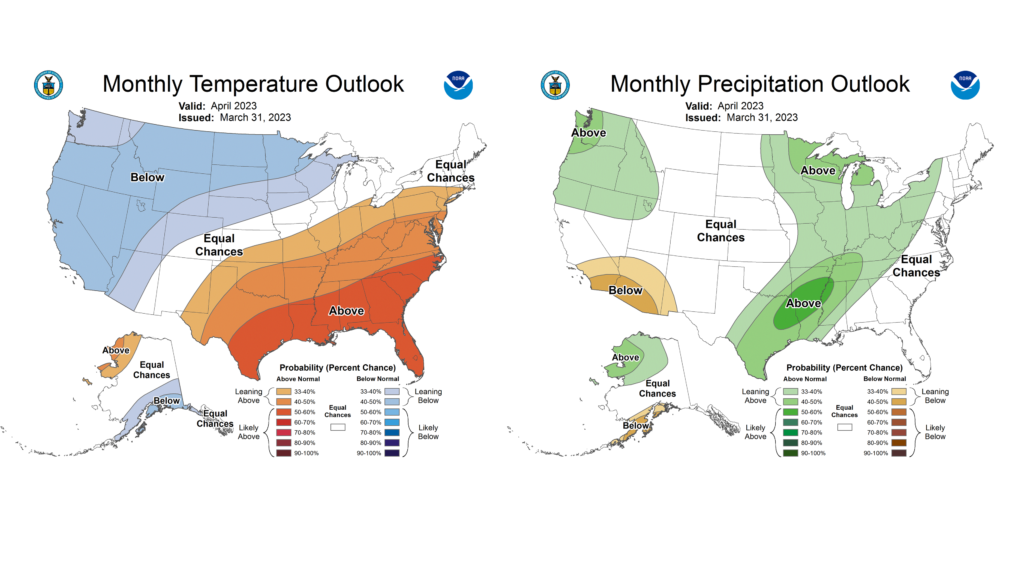
April is an eternally optimistic month full of celebration, reflection, and wonderful spring color. It’s also an important month for agriculture and spring flooding, and a mild, drier April can help with both. The latest April outlooks from the Climate Prediction Center lean warmer and wetter than normal for the month (Figure 6). If wetter conditions do prevail this month–and with a very healthy snowpack present in the Upper Midwest–we’ll need to watch carefully for the risk of spring flooding, especially along the mainstem Mississippi River.
The three-month outlooks for April through June look similar, leaning to warmer and wetter than normal conditions across much of the state (Figure 7). The wetter outlook does not necessarily spell planting delays in Illinois, but it does suggest the windows of opportunity for spring fieldwork may be unusually tight.
