The preliminary statewide average August temperature was 75.6 degrees, 2 degrees above the 1991–2020 average and tied for the 20th warmest on record going back to 1895. The preliminary statewide average total August precipitation was 3.76 inches, 0.20 inches above the 1991–2020 average and the 50th wettest on record going back to 1895.
Data are provisional and may change slightly over time
August Heat & Humidity
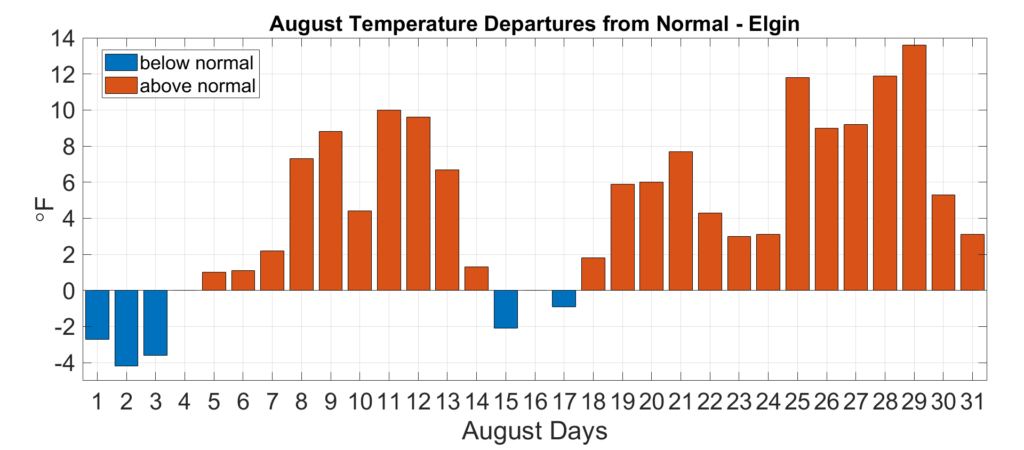
Apart from the first few days of the month, August temperatures were largely above normal across Illinois. As Figure 1 shows, all but 5 days in August had above normal temperatures in Elgin, and several days in the last week of August exhibited temperatures that were 10 to 15 degrees above normal.
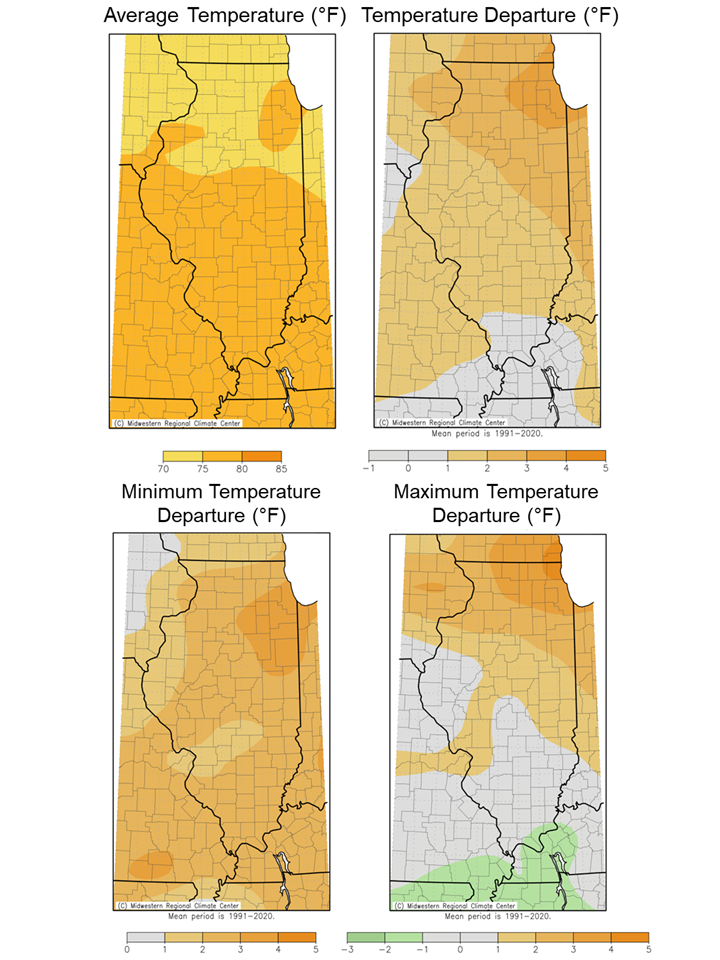
Overall, the August average temperature ranged from the low 70s in northern and north-central Illinois to the high 70s in southern Illinois. Last month was 2 to 4 degrees warmer than normal in northern Illinois and within 1 degree of normal in southern Illinois. However, as the maps in the bottom panel of Figure 2 show, daily August minimum temperatures had larger deviations from normal than daily maximum temperatures. In fact, in far southeast Illinois August minimum temperatures were 2 to 3 degrees above normal, while maximum temperatures were 1 to 2 degrees below normal.
Unusually high nighttime low temperatures last month were partly caused by persistently high humidity. One useful measure of humidity is the dewpoint temperature, which is the air temperature at which the air is saturated. Higher dewpoint temperatures indicate higher humidity, and humans begin to feel uncomfortable as dewpoints exceed 65 degrees.
The figure below shows the hourly frequency of dewpoint temperature observations exceeding 65 degrees at Champaign last month. Frequencies from last month (orange bars) are compared with average frequencies over the past 40 years (blue bars). August dewpoint temperatures exceeded 65 degrees more frequently than usual in each of the 24 hours of the day in Champaign, but the largest anomalies were in the early morning between 1 and 5 a.m. For example, well over half of the 3 a.m. dewpoints exceeded 65 degrees in Champaign last month, compared to around 30 percent of days on average. August in Champaign had the 2nd highest frequency of 3 a.m. dewpoint temperature observations.

Overall, the preliminary statewide average August temperature was 75.6 degrees, 2 degrees above the 1991–2020 average and tied for 20th warmest on record going back to 1895.
Climatological Summer Temperatures
August brings a wrap-up of climatological summer. Summer average temperatures ranged from the high 60s in southern Illinois to the mid- to high 70s in southern Illinois. This summer was 1 to 3 degrees warmer than average in the northern one-third of the state, and within 1 degree of normal south of Interstate 74. Similar to August, we saw large differences between minimum and maximum temperature departures. Summer minimum temperatures were 1 to 4 degrees above normal statewide, while summer maximum temperatures were more than 1 degree above normal only north of Interstate 80.

Wet, Active Weather in Northern Illinois
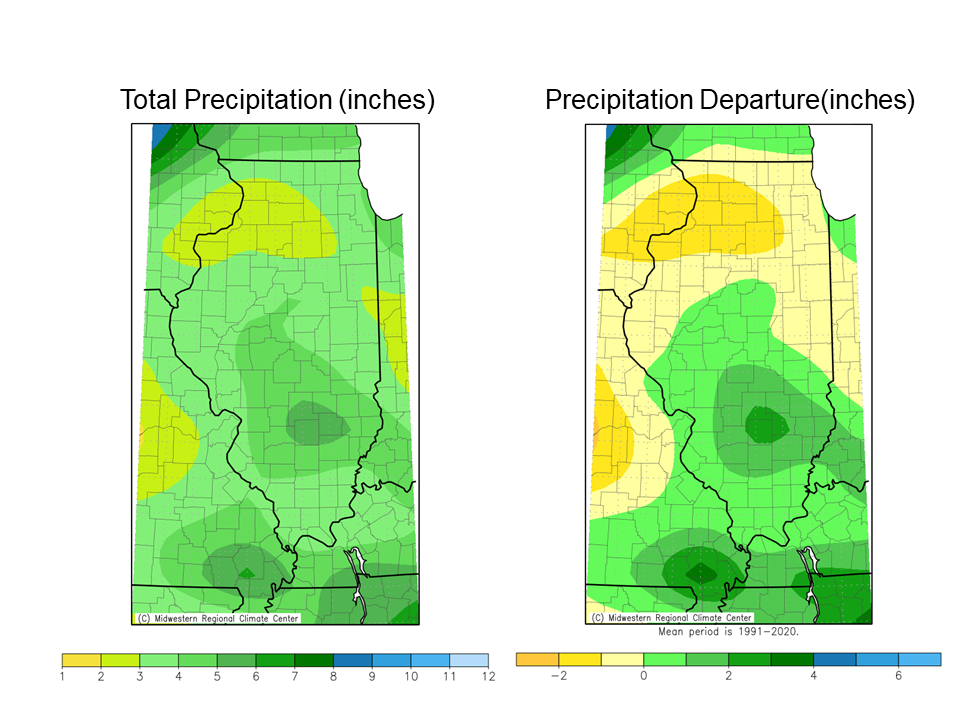
August precipitation totals ranged from less than an inch in parts of northwest and western Illinois to over 11 inches in north-central Illinois. Last month was 1 to 3 inches drier than normal throughout most of the northern two-thirds of the state and was between 1 and 5 inches wetter than normal in southern Illinois.
Because of the heat and humidity, August precipitation was accompanied by frequent severe weather events including several tornadoes, hail, and strong winds. Seven confirmed tornadoes touched down in northern Illinois on August 9 alone, including three EF-1 tornadoes. The five National Weather Service offices serving Illinois issued a combined 18 tornado warnings last month, the second most for August on record going back to 1986. Additionally, there were 93 severe thunderstorm warnings issued in Illinois last month, tied for the fourth most on record for August.
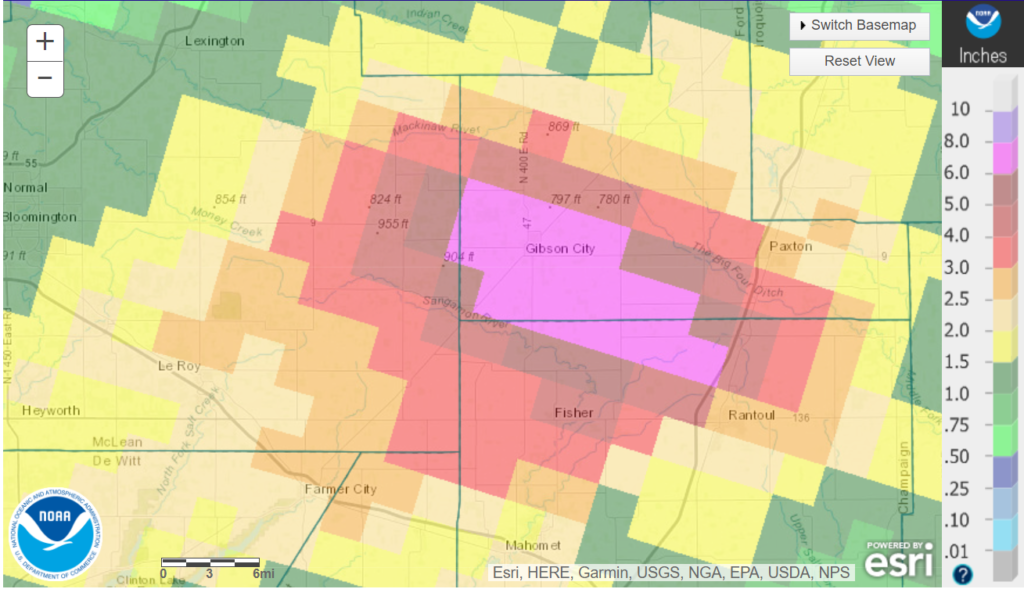
On August 12, a series of thunderstorms moved over the same area of north-central Illinois for hours, a phenomenon called training. The storms produced 4 to 5 inches of rain in just 6 hours across parts of McLean, Champaign, and Ford Counties in central Illinois. The epicenter of the heavy rainfall was Gibson City in Ford County, which received 10 to 12 inches in less than 6 hours on August 12. Consequently, Gibson City suffered from destructive urban flooding that displaced residents and flooded roads and buildings.
Overall, the preliminary statewide average total August precipitation was 3.76 inches, 0.20 inches above the 1991–2020 average and the 50th wettest on record going back to 1895.
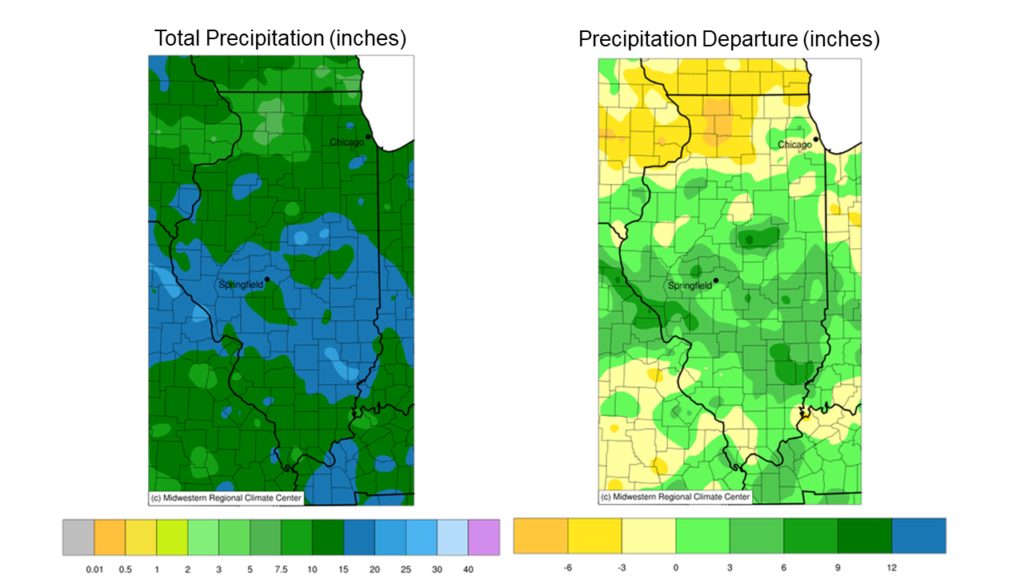
August ended a mostly wetter than normal summer for Illinois. Total summer precipitation ranged from around 5 inches in northwest Illinois to over 25 inches in parts of southeast and central Illinois. Most of the northwest corner of the state was 3 to 5 inches drier than normal this summer, while parts of central and south-central Illinois were 9 to 12 inches wetter than normal.
Outlooks
The fall season has begun with cooler and less humid weather across Illinois, much to the relief of us all. As crops continue to mature and we inch toward sweaters and pumpkin-flavored drinks, we look to what the season has in store.
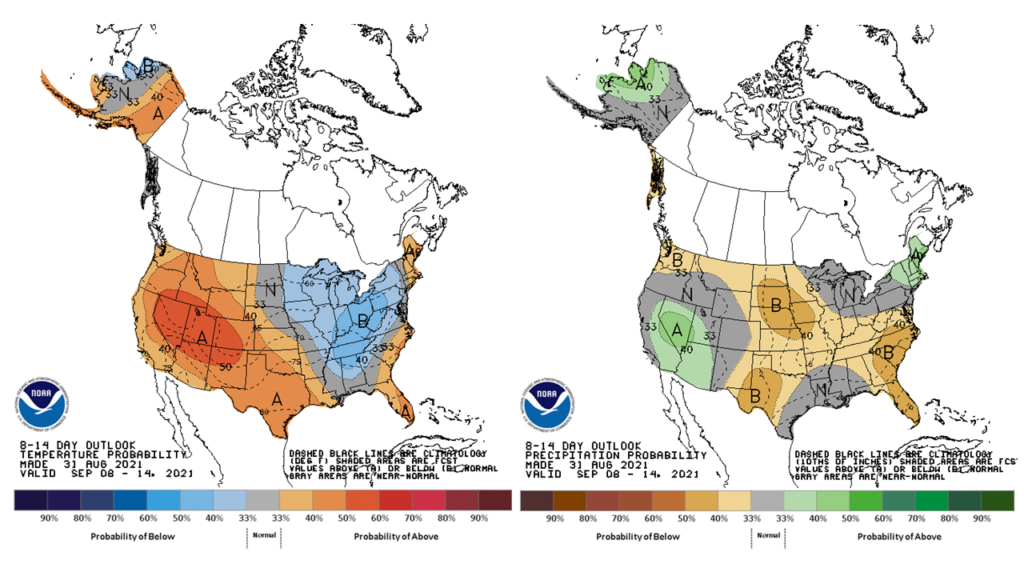
Climate Prediction Center outlooks for the second week of September show strongly elevated odds of below normal temperatures sticking around, with slightly elevated chances of below normal precipitation statewide.
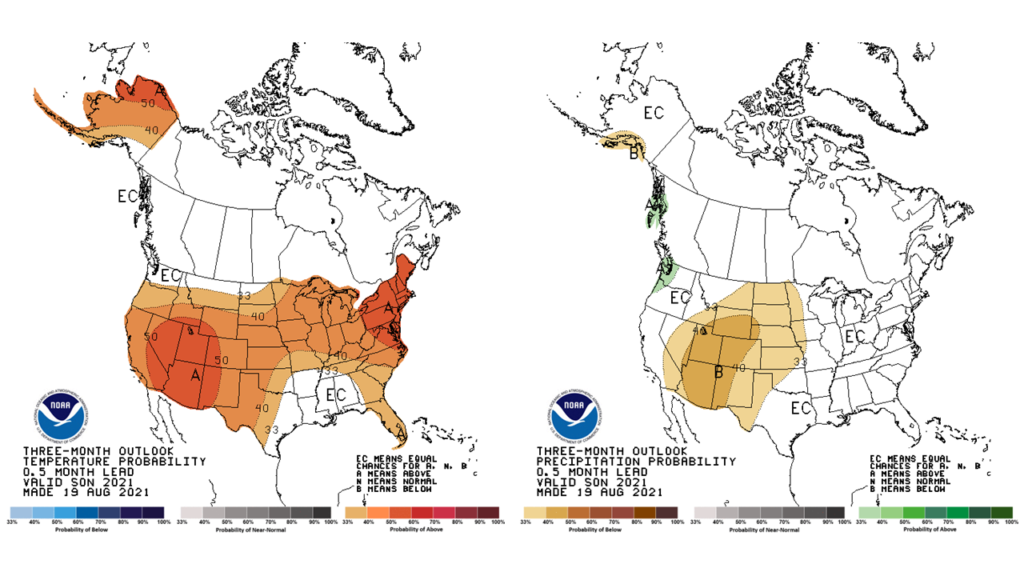
Although outlooks for the entire month of September do not show any expectations as to wetter, drier, hotter, or colder than normal, the 3-month outlooks for September through November lean toward warmer than average conditions across the Midwest.