The preliminary statewide average July temperature was 74.6 degrees, 0.8 degrees below the 1991–2020 average and tied for the 45th coldest on record going back to 1895. The preliminary statewide average total July precipitation was 5.37 inches, 1.31 inches above the 1991–2020 average and tied for the 18th wettest on record going back to 1895.
Data are provisional and may change slightly over time
Cool but Humid July Weather
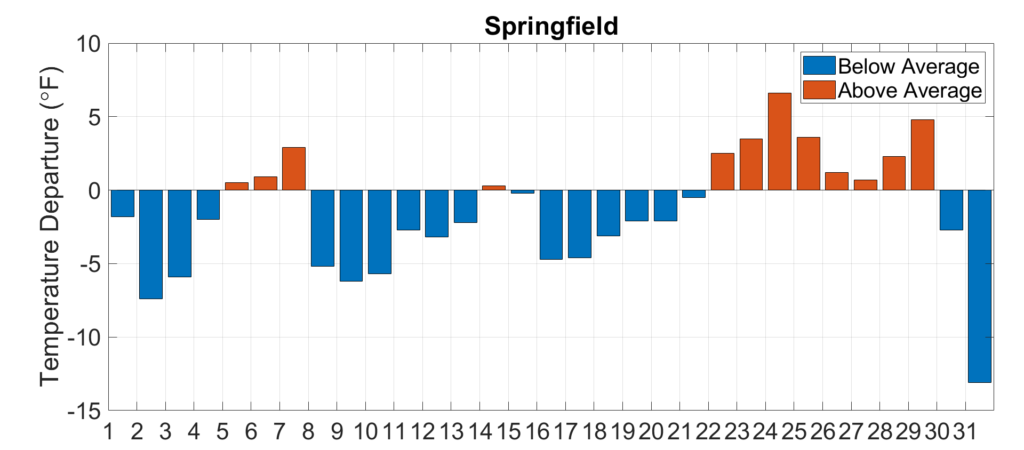
Apart from a late-month heat wave, temperatures in July were mostly below the 1991–2020 normal. Figure 1 shows daily average July temperature departures in Springfield. Most places observed a single-digit number of days with a high temperature above 90 degrees. For example, Carbondale observed only 9 days in July with a high temperature above 90 degrees, the 10th fewest on record there going back to the early 1900s. Comparatively, Carbondale recorded 29 days with a high above 90 degrees in 2012.
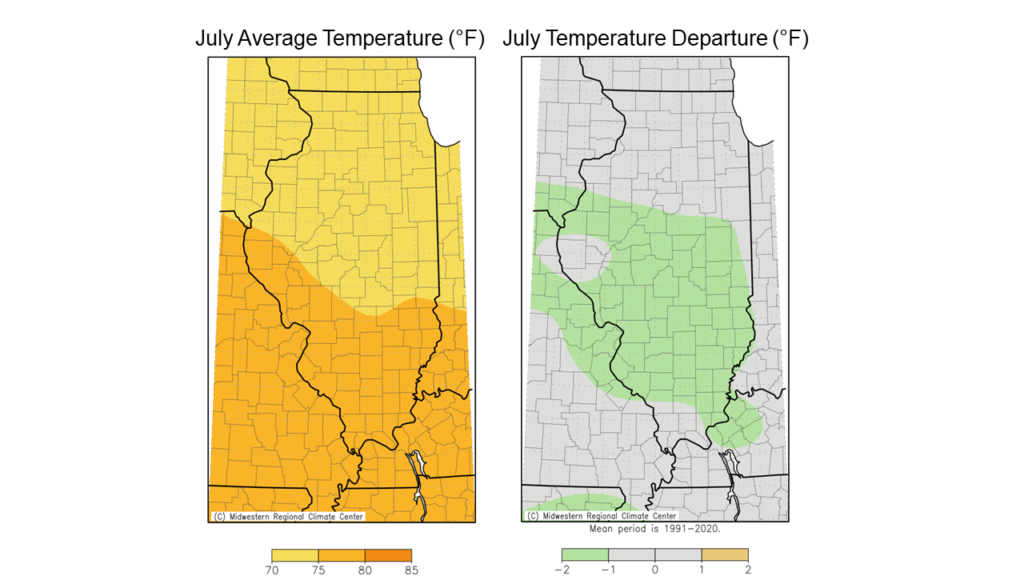
Most of central Illinois was between 1 and 2 degrees below normal for the month of July, while northern and southern Illinois were less than 1 degree below normal for the month (Fig. 2). Last month, 45 daily low maximum temperature records were broken across the state, including a 67-degree high temperature on July 11 in Kewanee. Additionally, three daily low minimum temperature records were broken in July. Rock Island was the lone station with a broken high maximum temperature record in July, with a 99-degree high on July 28, and Barrington was the only station with a broken high minimum temperature record last month, with a 72-degree low on July 24.
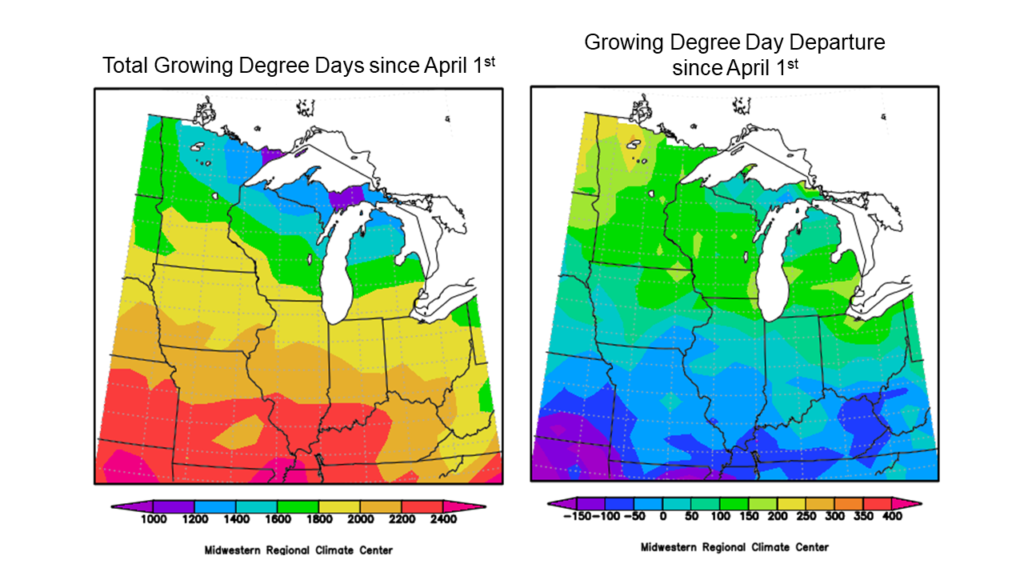
The cooler July temperatures maintained growing degree day (GDD) accumulation departures from the end of June. The maps below in Figure 3 show total GDD accumulation and departures from the 1991–2020 normal since April 1. As of the start of August, growing degree day accumulation is ahead of normal in northern Illinois and slightly to much below normal in southern Illinois.
Overall, the preliminary statewide average July temperature was 74.6 degrees, 0.8 degrees below the 1991–2020 average and tied for the 45th coldest on record going back to 1895.
July Humidity
Continental-scale atmospheric circulation and the high pressure over the north-central Atlantic Ocean maintained the movement of moisture and humidity out of the Gulf of Mexico into the Midwest all month. The result was a very humid July, even by recent climate standards. Stations in both Jacksonville and Taylorville recorded dew point temperatures of 86 degrees in the afternoon of July 28, which was the highest dew point observed at both stations on their 15+ year records.
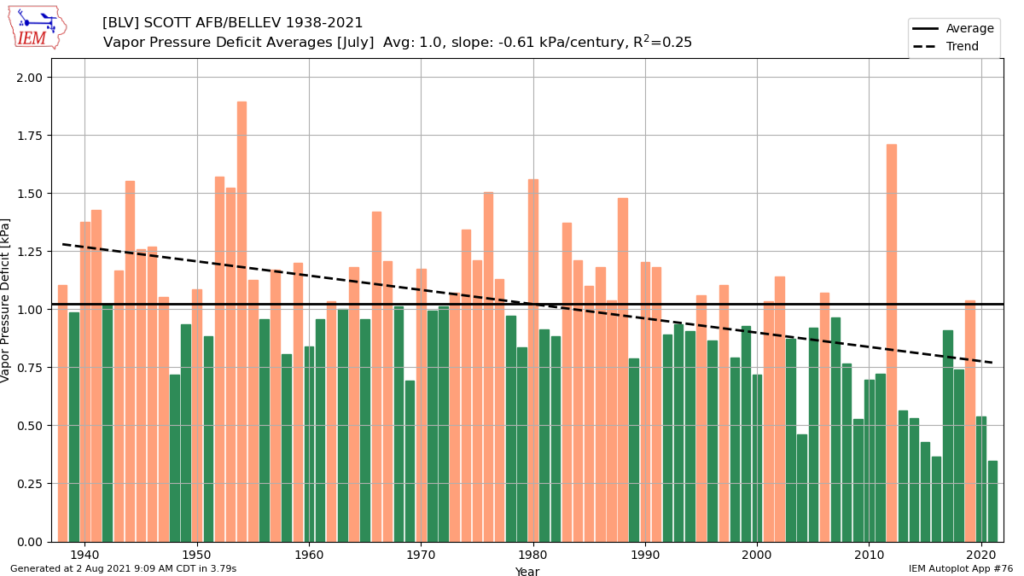
Another way of representing humidity is the vapor pressure deficit (VPD). The potential amount of humidity in the air is dependent on temperature, and VPD is a measure of how much humidity is in the air relative to how much could potentially be in the air at that temperature. Therefore, a low VPD indicates a humidity level that is very close to the maximum potential humidity at that temperature, and when VPD nears zero, the air approaches saturation. The plot below (Fig. 4) shows last month’s average VPD at Scott Air Force Base near Belleville was the lowest (i.e., most humid) on record going back to 1938.
“Rinse and Repeat” Rainfall Patterns in July
High humidity and southerly flow off the Gulf of Mexico helped continue to fuel scattered thunderstorms across the state in July. Combined with a handful of mesoscale systems that moved across the Midwest last month, most of Illinois experienced a near to wetter than average July.
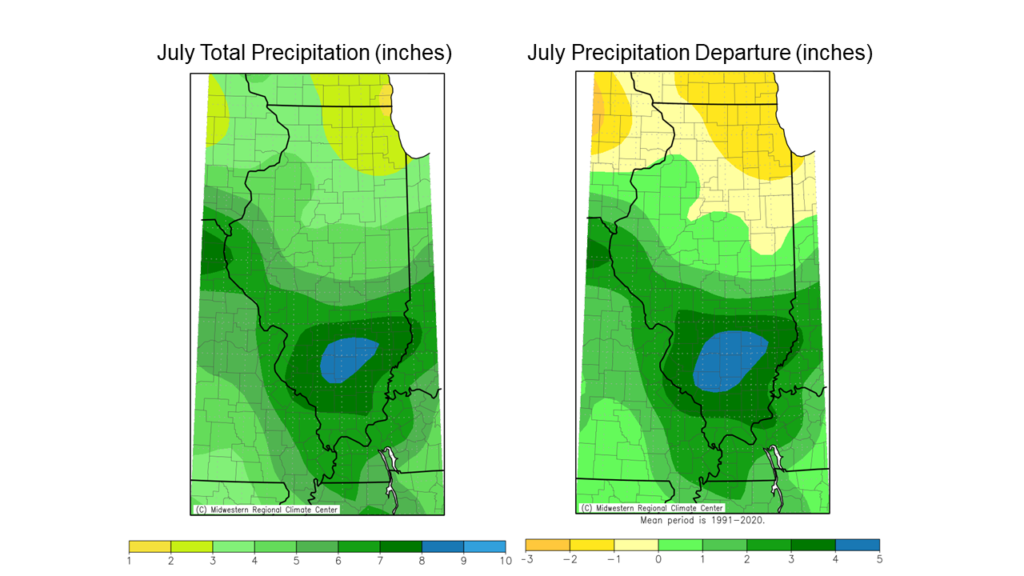
The maps in Fig. 5 show total July precipitation ranged from less than 2 inches in the northeast part of the state to over 10 inches in south-central Illinois. Long-running precipitation deficits in northern Illinois grew as July rainfall was 2 to 3 inches below normal there, within 1 inch of normal in most of central Illinois, and 2 to 5 inches above normal in southern Illinois.
Last month was the second wettest on record in Salem in Marion County (9.01 inches) going back to 1915, and the seventh wettest on record in Du Quoin in Perry County (7.78 inches) going back to 1942. In contrast, Chicago observed only 1.9 inches in July, which was the 27th driest on record there going back to 1871. Chicago has recorded 15.63 inches of rain since the start of the year, making the first 7 months of 2021 the 20th driest on record and the driest since 2005.
Drought Continues in Northern Illinois
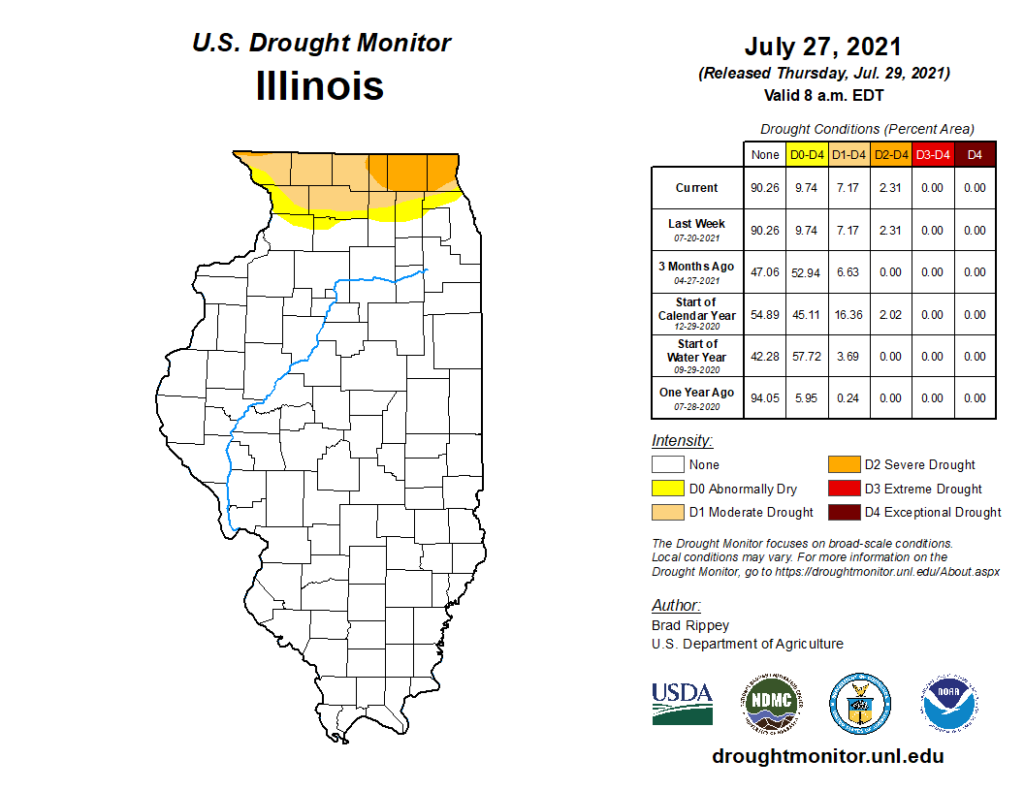
Below normal temperatures throughout July helped alleviate stress from high evaporation rates in drought-stricken northern Illinois. However, most of northeast Illinois was unable to make progress reducing long-running precipitation deficits last month. The latest version of the U.S. Drought Monitor released on July 29 showed most of northern Illinois from Jo Daviess County to Cook County remained in moderate drought, and parts or most of Boone, McHenry, and Lake Counties were in severe drought (Fig. 6).
Lake and McHenry Counties in particular have been in at least severe drought for 11 consecutive weeks, going back to late May. Soil moisture and streamflow in this area remain well below average for this time of the year, and several reports of ecological and agricultural impacts–including trees dropping leaves and corn showing signs of drought stress–have come from the area.
Overall, the preliminary statewide average total July precipitation was 5.37 inches, 1.31 inches above the 1991–2020 average and tied for the 18th wettest on record going back to 1895.
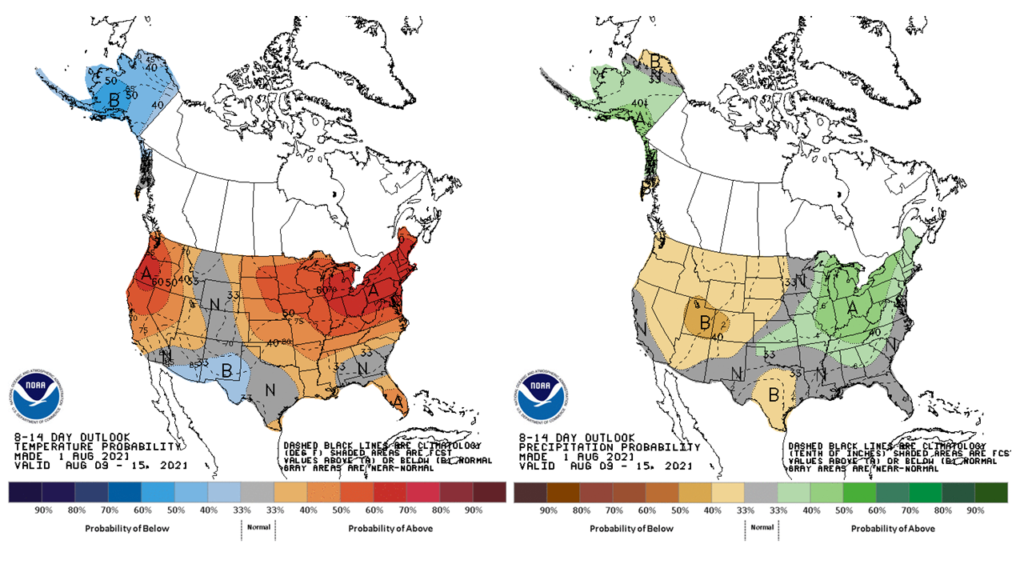
Outlooks
Moderate temperatures and dry weather ended July and started the month of August. However, outlooks from the Climate Prediction Center indicate the potential for a transition to more summer-like conditions. Outlooks show strongly elevated odds of warmer than normal conditions and elevated odds of wetter than normal conditions in the second week of August (Fig. 7).