The preliminary statewide average September temperature was 69.4 degrees, 2.6 degrees above the 1991–2020 average, and tied for the 21st warmest on record going back to 1895. The preliminary statewide average total September precipitation was 2.38 inches, 0.97 inches below the 1991–2020 average and tied for the 36th driest on record going back to 1895.
Data are provisional and may change slightly over time
September was hot, but less humid
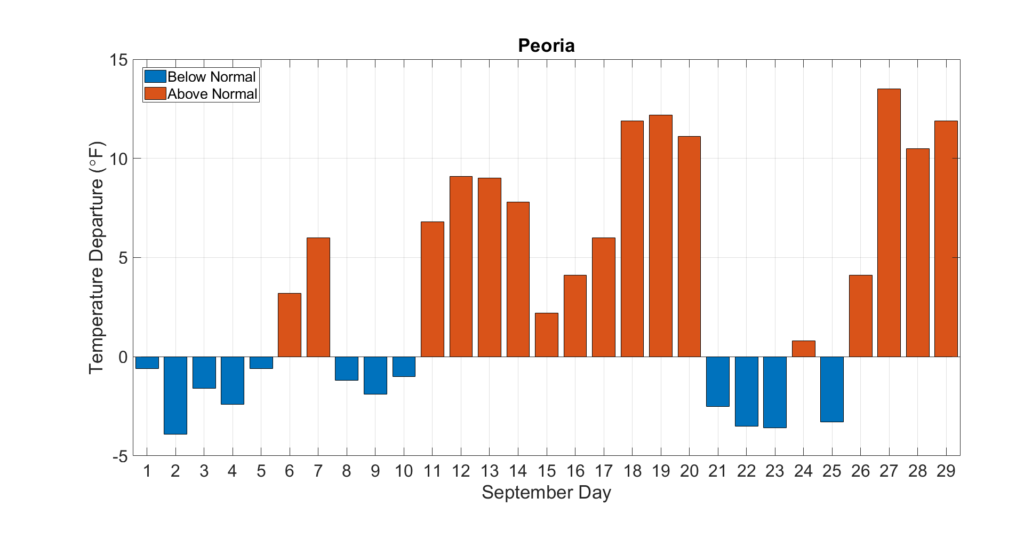
The cooldown that started the month of September gave us a taste of fall, but it was fleeting. Most of September passed with above normal temperatures across the state, and as Figure 1 shows from Peoria, temperatures on the hottest days were 5 to 15 degrees above normal.
Warmer weather in September broke 15high daily maximum temperature records and 4high daily minimum temperature records across the state, including a record-breaking 77-degree minimum temperature in Alton on September 19. In contrast, only two low daily maximum temperature records and two low daily minimum temperature records were broken last month. The highest maximum temperature recorded last month was 94 degrees in Alton, while the lowest minimum temperature recorded last month was 36 degrees in Galena.
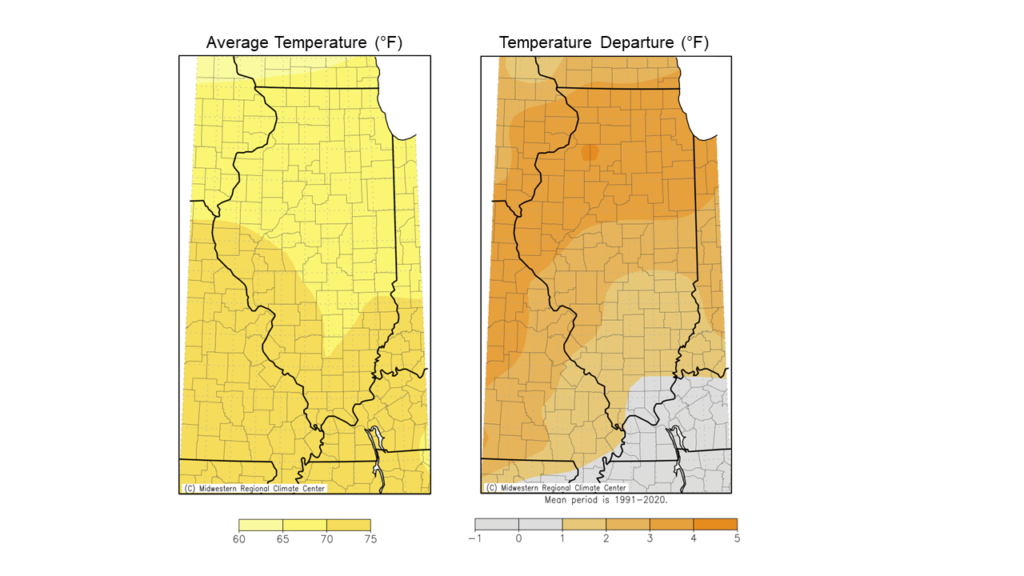
Overall, the September average temperature ranged from the mid- to high 60s in northern and north-central Illinois to the low 70s in southern Illinois. Last month was 3 to 5 degrees warmer than normal in northern Illinois and within 1 degree of normal in southern Illinois (Figure 2).
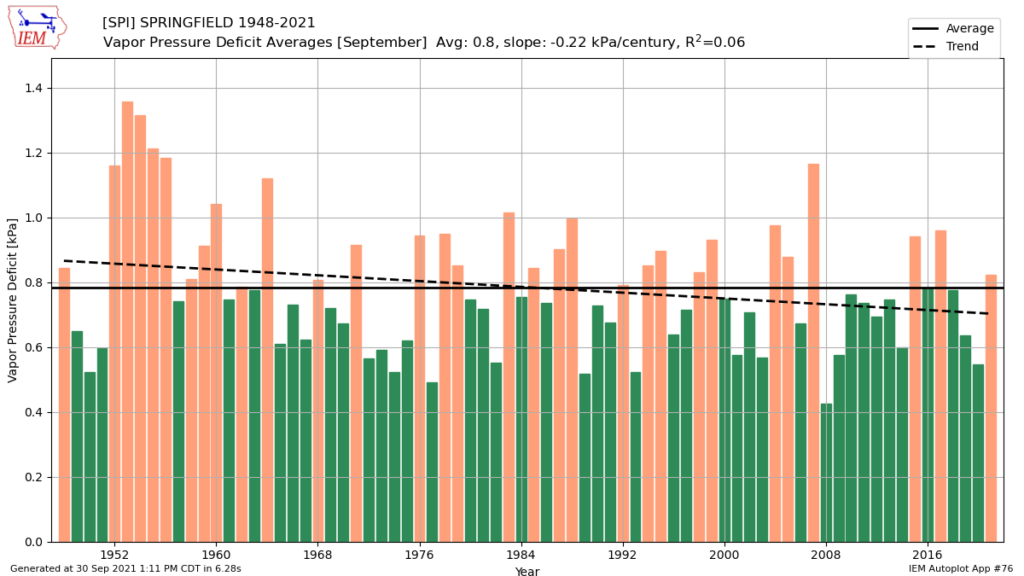
Despite the higher temperatures last month, the unusually high humidity across the state in July and August disappeared in September. Figure 3 shows the September average vapor pressure deficit, a representation of humidity, in Springfield. The above average vapor pressure deficit last month illustrates less humid conditions compared to Septembers in 2018, 2019, and 2020.
Overall, the preliminary statewide average September temperature was 69.4 degrees, 2.6 degrees above the 1991–2020 average and tied for the 21st warmest on record going back to 1895.
Split Precipitation Pattern… Again
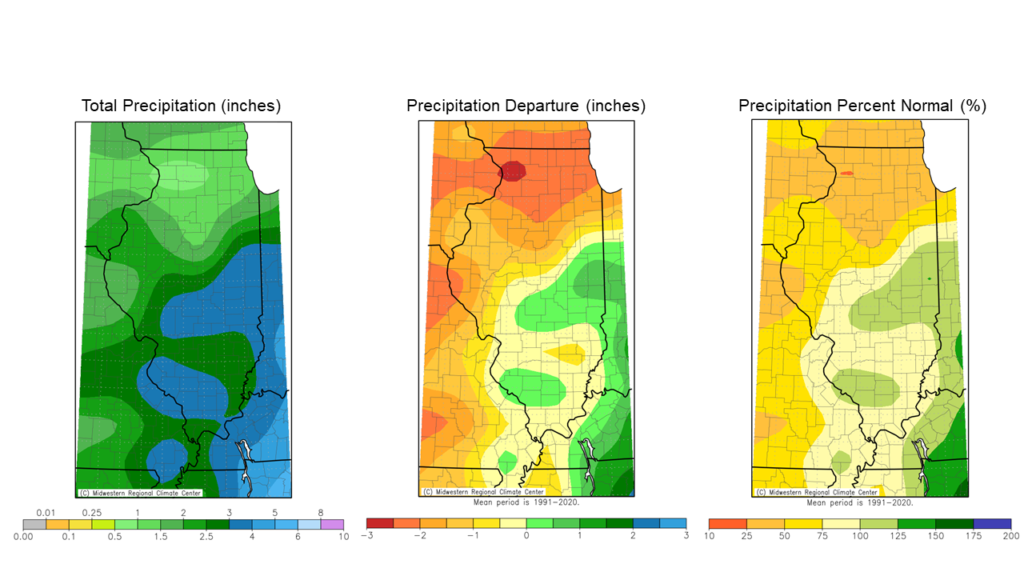
southern and central Illinois and dry in northern Illinois. September’s precipitation totals followed suit. Last month’s precipitation totals ranged from less than an inch northwest Illinois to over 5 inches in east-central and southern Illinois. September was 2 to 3 inches drier than normal throughout northern Illinois and near normal to about 1 inch wetter than normal in central and southern Illinois (Figure 4).
September was one of the drier months of the warm season, so despite only 0.53 inches of rain recorded last month, it was still only the seventh driest September on record in Rockford. However, dry conditions last month added to very dry spring and summer seasons in northern Illinois. The 2020-2021 water year, which runs from October 1 to September 30, was the third driest on record in Rockford. Total water year precipitation in Rockford was 21.69 inches, approximately 60 percent of average and 4 inches less than the 2011-2012 water year.
Overall, the preliminary statewide average total September precipitation was 2.38 inches, 0.97 inches below the 1991–2020 average and tied for 36th driest on record going back to 1895.
Northern Illinois Drought
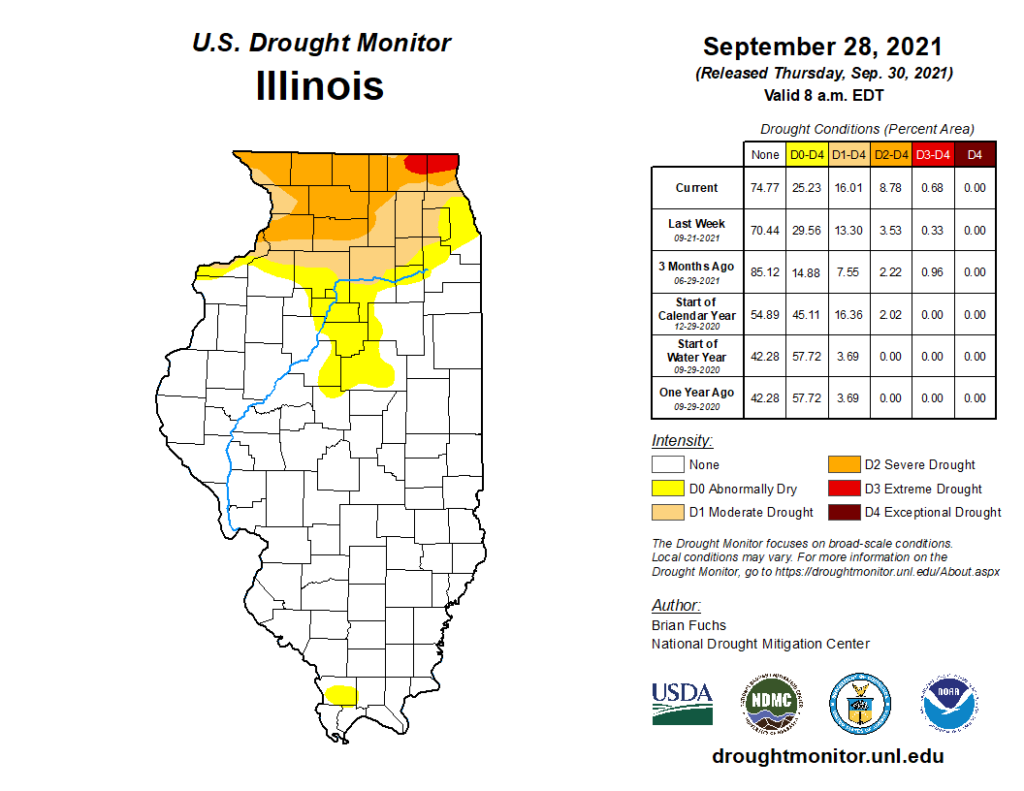
Very dry conditions last month added to existing precipitation deficits in northern Illinois. In response, the latest U.S. Drought Monitor expanded severe and moderate drought across the northern third of the state and expanded extreme drought in McHenry County (Figure 5). The percentage of the state in severe drought (8.78%) is the highest since fall of 2013.
Agricultural and ecological impacts have mostly run their course by this time of the year. However, the dry conditions have left substantial soil moisture deficits across northern Illinois, and a near to wetter than normal winter will be necessary to recharge dry soils. A healthy, persistent snowpack across northern Illinois would also go a long way to help improve soil moisture conditions as we move into next spring.
Outlooks
The gap between the 30-year normal September average temperature and October average temperature is the largest of any two months statewide, at 11.5 degrees. This means that as we look ahead, irrespective of the outlook, temperatures will decrease as we move into October.
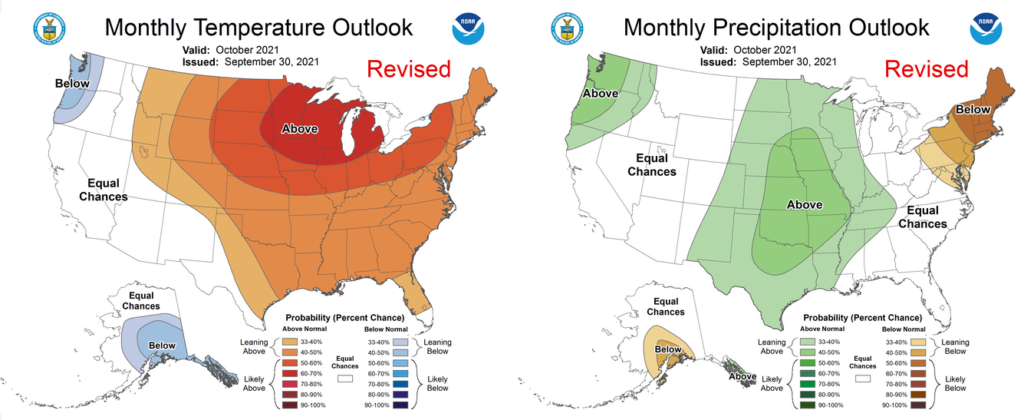
With that said, the most recent Climate Prediction Center outlooks for the entire month of October show strongly elevated odds of above normal temperatures sticking around, though with slightly higher odds of wetter than normal conditions for the month as a whole (Figure 6).