June took a page out of March’s playbook—came in like a lamb and went out like a lion. Overall, the preliminary statewide average June temperature was 73.8 degrees, 1.6 degrees above the 1991–2020 average and tied for the 25th warmest on record going back to 1895. The preliminary statewide average total June precipitation was 5.33 inches, 0.68 inches above the 1991–2020 average and tied for the 30th wettest on record going back to 1895.
Data are provisional and may change slightly over time
Hot Start, Cooler End to June
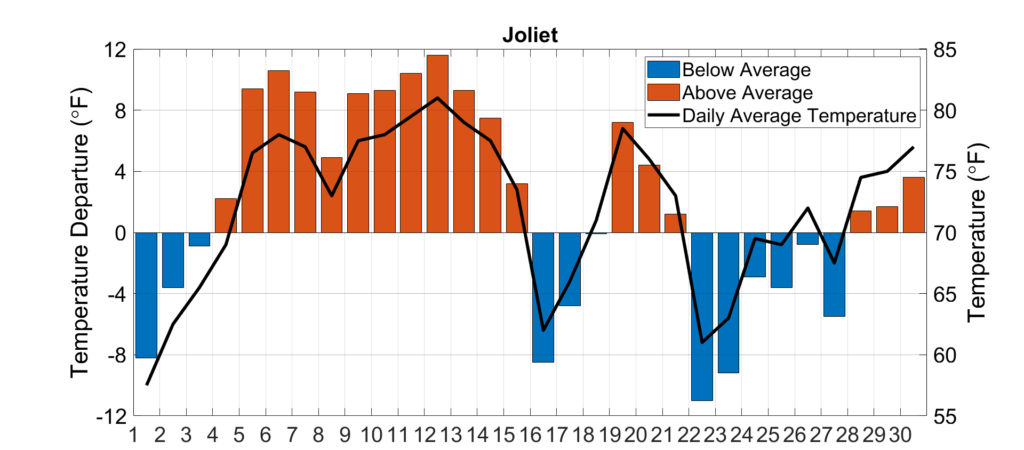
Drier soils in the northern two-thirds of the state helped elevate temperatures in the first half of June. Figure 1 shows daily temperature departures and daily average temperature this past month in Joliet. Most of northern and central Illinois experienced temperatures that were between 5 and 15 degrees warmer than normal in the first half of June. Rockford recorded 13 days with a high temperature at or above 90 degrees, the fourth most for any June on record there back to 1893.
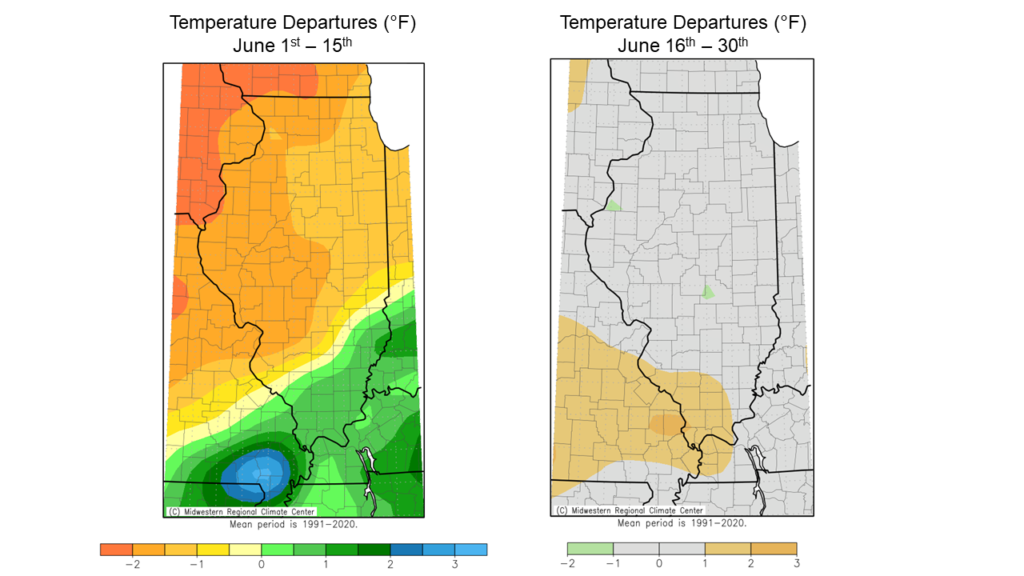
While northern Illinois stayed hot and dry in the first two weeks of June, temperatures in southern Illinois remained near to slightly cooler than normal (Figure 2). Temperatures in the latter half of the month were within 1 degree of normal north of Interstate 64, and between 1 and 2 degrees above normal in southern Illinois.
The warm start to June broke 31 daily high maximum temperature records and 15 daily high minimum temperature records. The subsequent cooldown in the third week of June broke 12 daily low minimum temperature records across the state.
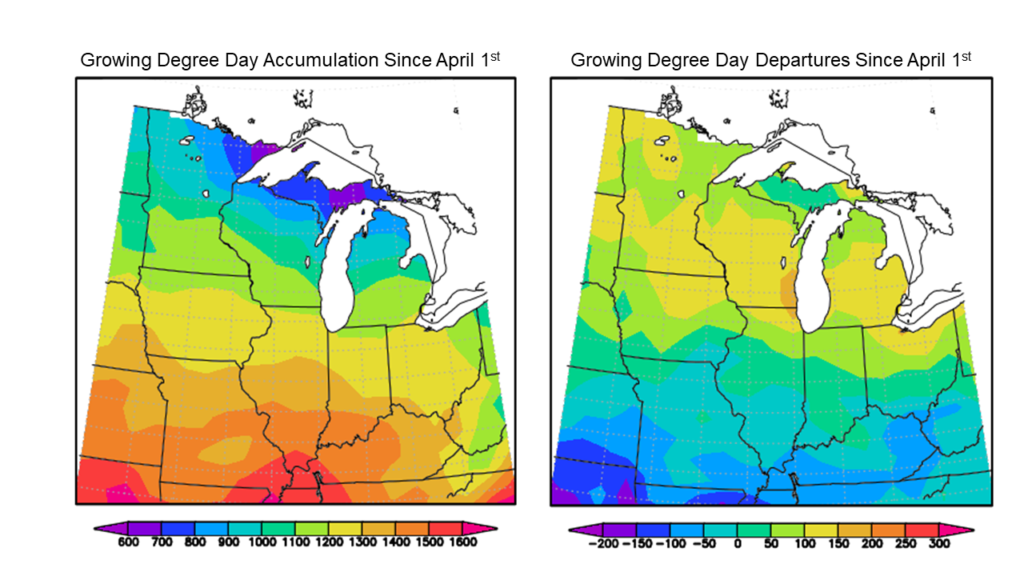
Following a slow start to the growing season from cooler April and May weather, June temperatures helped accumulate growing degree days (GDD). The maps below in Figure 3 show total GDD accumulation and departures from the 1991–2020 normal since April 1. As of the start of July, growing degree day accumulation is ahead of normal in northern Illinois and slightly to much below normal in southern Illinois.
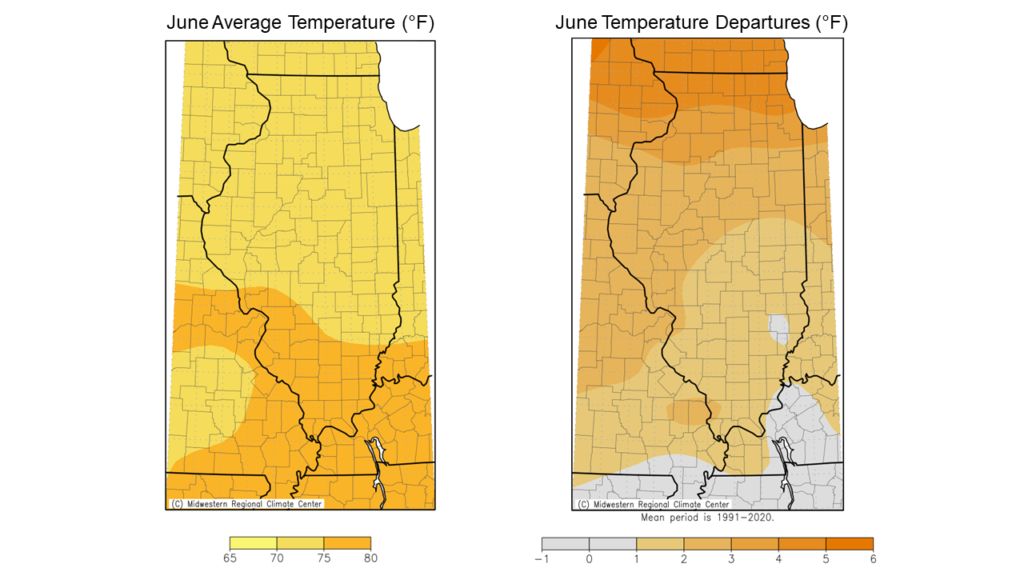
Overall, June average temperatures ranged from the low 70s in northern and central Illinois to the mid- to high-70s in southern Illinois, between 1 and 5 degrees warmer than normal across the state (Figure 4). The preliminary statewide average June temperature was 73.8 degrees, 1.6 degrees above the 1991–2020 average and tied for 25th warmest on record going back to 1895.
Wild End to Otherwise Dry June
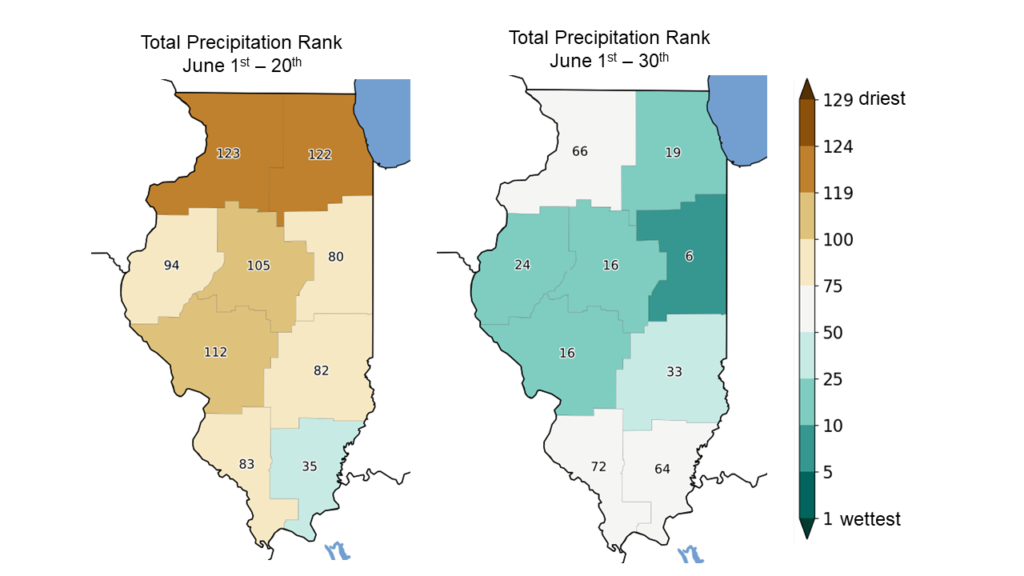
The first two-thirds of June was very dry across Illinois (Figure 5). In fact, the period between June 1 and 20 was the sixth and seventh driest on record in the northwest and northeast Illinois climate divisions, respectively. As the large atmospheric ridge established over the Pacific Northwest, most of Illinois found itself on the edge of a stationary front that produced several rounds of heavy rain from the St. Louis Metro East to Chicagoland. Due to the very wet last 7 to 10 days of the month, June ended wetter than average in all but the northwest and southwest climate divisions, and it was the sixth wettest on record in the east-central division.
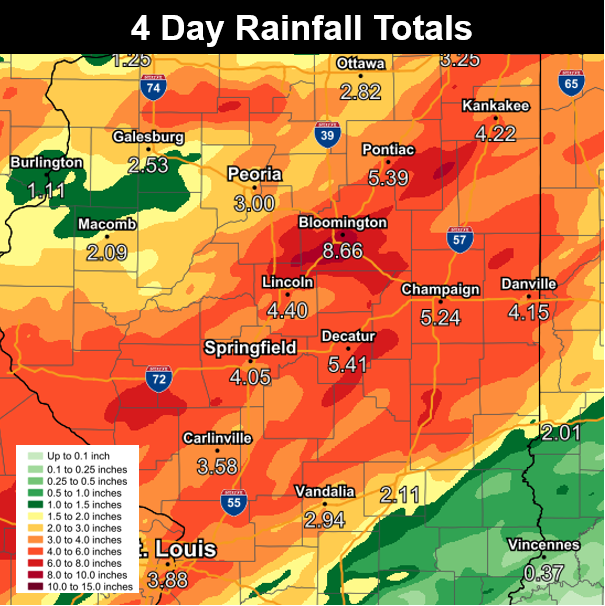
Rain in the final week of June was particularly heavy along the Interstate 55 corridor between Bloomington-Normal and Chicago. Areas of McLean and Livingston Counties observed 8 to 10 inches of rain in just 4 days (Figure 6), resulting in serious flooding in Bloomington, flooding on and the temporary shutdown of Interstates 55 and 74, and standing water in fields across central and northeast Illinois.
CoCoRaHS observers in both south Bloomington and Heyworth in McLean County observed over 10 inches of rain in just 3 days between June 25 and 27. According to the recently published Bulletin 75, these totals exceeded the 1% annual probability or “100-year” rainfall event by 1.5 inches.
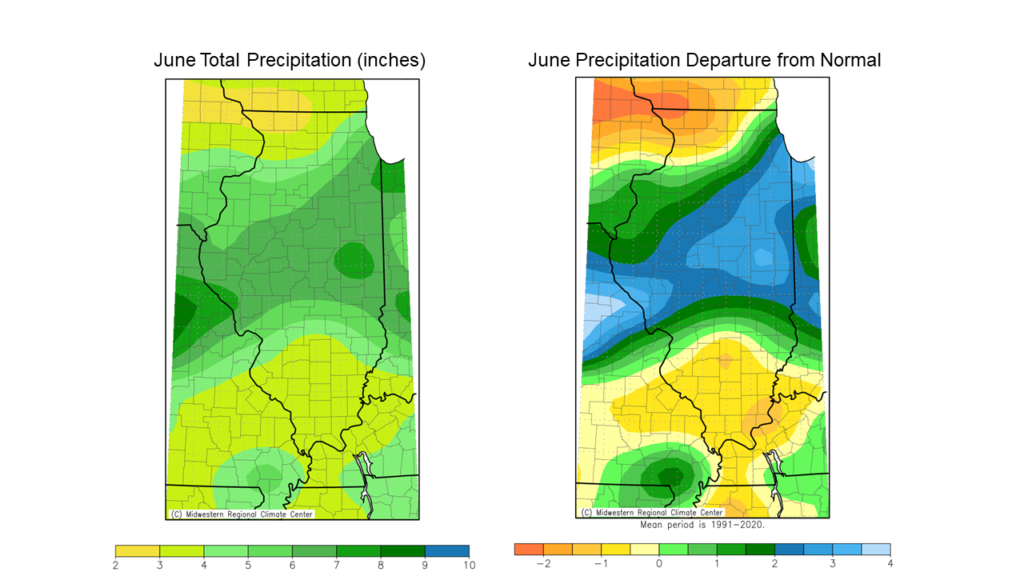
Total June rainfall ranged from less than 3 inches in far northwest and southeast Illinois to over 12 inches in central and east-central Illinois (Figure 7). Most areas between the St. Louis Metro East and Chicago areas were between 1 to 5 inches wetter than normal, while southern and northwest Illinois were 1 to 3 inches drier than normal. Overall, the preliminary statewide average total June precipitation was 5.33 inches, 0.68 inches above the 1991–2020 average and tied for the 30th wettest on record going back to 1895.
Drought Continues in Northern Illinois
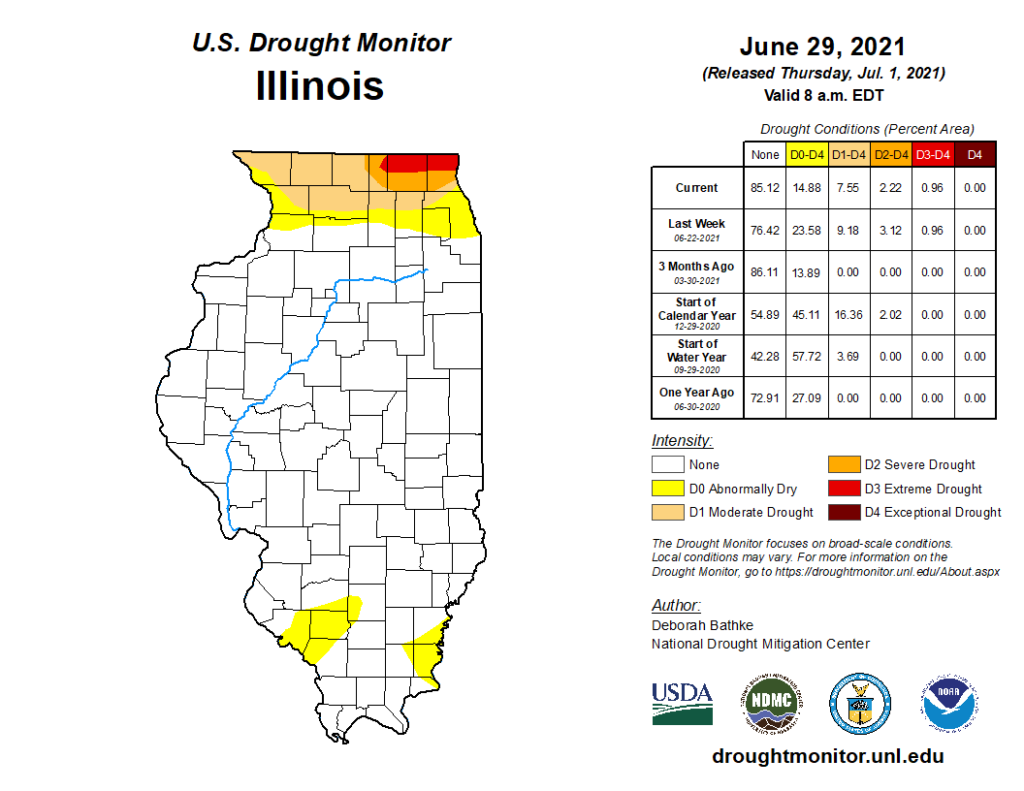
The dry, hot start to June culminated in the U.S. Drought Monitor introducing extreme drought in northeast Illinois in mid-June in response to very dry soils, low streamflow in major streams, and increasingly concerning crop stress. Persistent heavy rains in the Chicagoland area in late June were crucial to improving drought conditions and alleviating crop and water stress across the region. The most recent (July 1) edition of the U.S. Drought Monitor showed most of the southern and central Chicagoland metro area remained abnormally dry to near normal, which represented a significant improvement since mid-month (Figure 8). However, areas north of Interstate 88 and west of Interstate 39 did not receive as much rain in the final week of June, and drought conditions have worsened, particularly from Winnebago to Jo Daviess Counties. In fact, June was the fifth driest on record in Stockton in Jo Daviess County back to 1944, and the driest since 2012.
We will continue to monitor evolving conditions across Illinois and hope to see continued improvement in hydrology and ecology throughout northeast Illinois. Concurrently, the northwest corner continues to deteriorate as precipitation deficits increase. July is the climatologically warmest month in Illinois, and high temperatures can intensify dry conditions. Therefore, the northwest corner of the state will need near to above normal rainfall in July to curb worsening drought conditions.
Outlooks
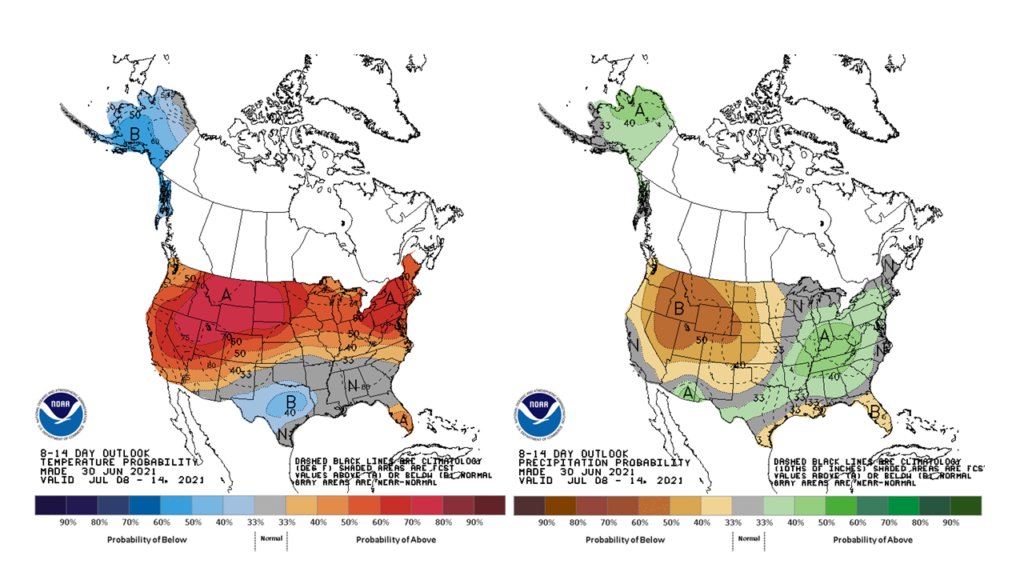
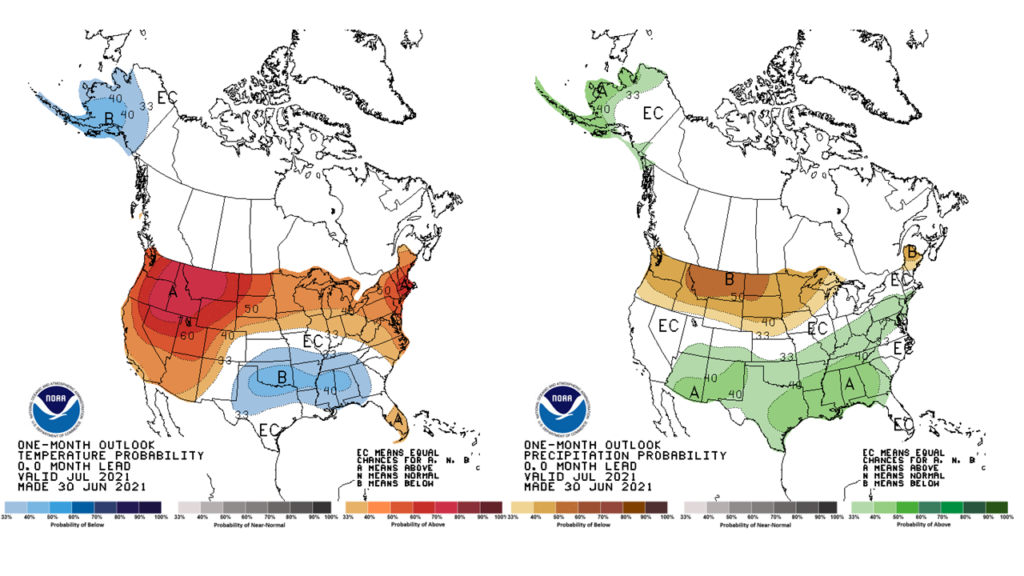
We’re in a bit of a transition in weather patterns to start July. Climate Prediction Center outlooks for the second week of the month show elevated odds of warmer and wetter than normal conditions statewide (Figure 9). Meanwhile, longer-term outlooks for the entire month of July do not show much of a strong signal in either temperature or precipitation (Figure 10). Illinois appears to be on a boundary between warm, dry conditions to our north and northwest and cooler, wetter conditions to our south and southeast. Climate prediction more than two weeks out in the summer is very difficult here in the Midwest, so we will have to see how shorter-term outlooks and forecasts evolve as we move deeper into the summer.