
Introduction
The Great Flood of 1993 resulted in $36.3 billion dollars in losses and 48 deaths. It was considered the 8th worst natural disaster in US history in terms of dollars. The top six were hurricanes, followed by the 1988 drought/heat wave. Large regions of the Missouri and Upper Mississippi River basins were impacted by heavy rains from June through August of 1993. The rains were widespread with the largest totals concentrated in Iowa.
I will share some climatic factors of the event. However, the most important thing to remember is that this was a large, slow-moving human disaster. I had friends and family in the affected area and it was indeed tough times. The St. Louis Post Dispatch recently did a story on the 25th Anniversary, showing the extent of the disaster.
In the end, I will try to answer the question – can it happen again?
Climate Factors
From the study by Kunkel, Changnon, and Angel (1994), other features of the 1993 Flood that made it so severe include:
- above-normal soil moisture at the beginning of June 1993
- large-sized areas of moderate to heavy rains
- the occurrence of rain areas orientated along the main stems of major rivers
- a large number of localized extreme daily rainfall total greater than 6 inches
- below-normal evaporation due to cooler temperatures and increased cloudiness
Several reports came out of the Flood of 1993, including this Water Survey report, this book by Stan Changnon, and this Federal report.
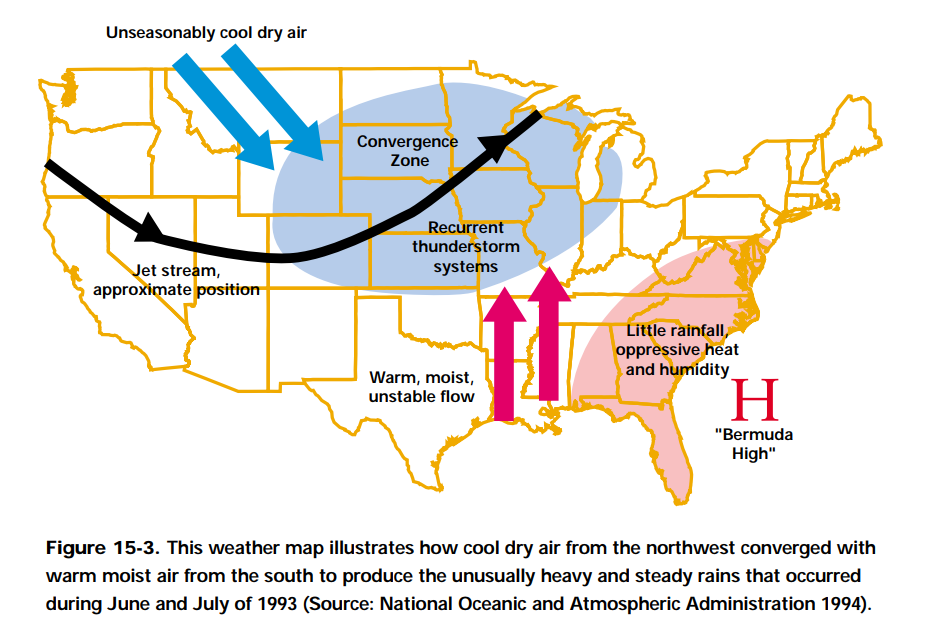
Here is a schematic of the weather conditions that persisted throughout much of June and July. The key features were the presence of the jet stream and the strong flow of warm, moist air into the region from the Gulf of Mexico. Even a few days of this pattern can produce sizable rainfall amounts in summer. Having it persist for three months resulted in the record rainfall and flooding.
Precipitation Totals
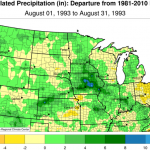
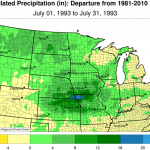
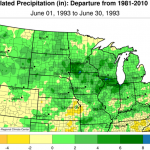
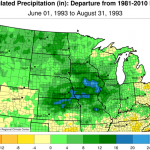
Here are the precipitation departures from normal maps for June, July, August, and the entire June-August period. Over the three-month period, precipitation departures of 16 inches or more (shades of blue) had accumulated in parts of KS, NE, MO, and IA.
Daily Precipitation
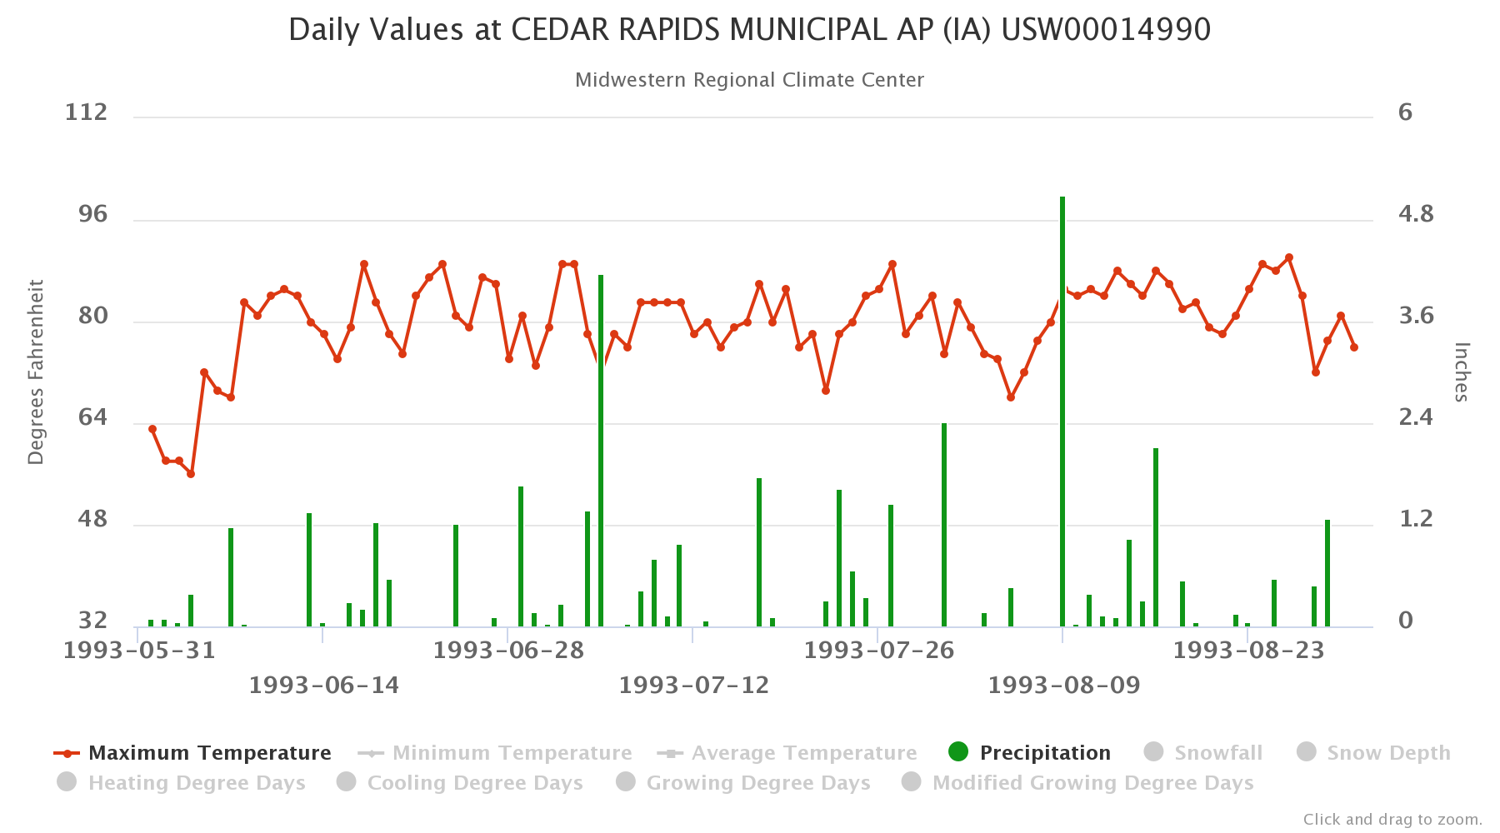
Here is the graph of what the daily temperature and precipitation pattern looked like at Cedar Rapids IA, probably ground zero for the precipitation in the 1993 Flood. The daily high temperatures (red line) were noteworthy for hovering in the 70s and low to mid-80s for much of the summer. The green bars represent the daily precipitation with 14 days of over an inch of precipitation and only a few days at a time without any precipitation. This sequence of frequent, heavy rains and little drying contributed to the flood and general misery.
Here are the top three precipitation totals for June-July-August in Illinois:
- Aledo with 32.41 inches
- Illinois City Dam with 31.23 inches
- Canton with 30.58 inches
And for Iowa, the totals are even larger:
- Clutier with 42.04 inches
- Jewell with 39.03 inches
- Cedar Rapids Airport with 38.92 inches
Impact on the Rivers
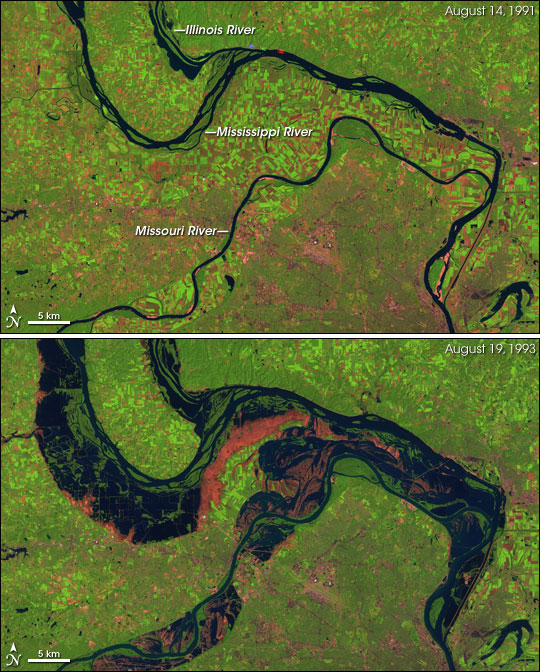
Here is the famous NASA satellite composite photo of the confluence of the Missouri, Illinois, and Mississippi Rivers near St. Louis before and during the 1993 Flood. I remember flying over this area in late July or early August and it looked like one large lake. There was even some concern that the Missouri and Mississippi might develop a new cutoff several miles upstream of their current meeting point.
Can the Great Flood of 1993 happen again in our lifetime?
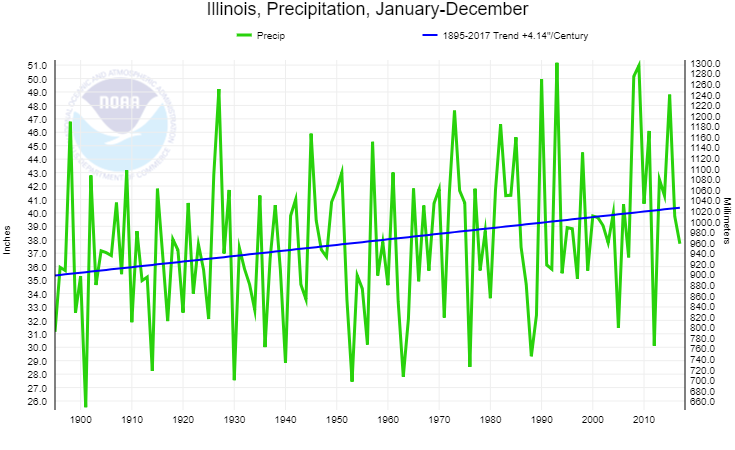
The clear answer is yes. Illinois and other states in the Midwest have been getting progressively wetter over the last century. In fact, the annual precipitation in Illinois has increased by over 4 inches since 1895, as shown in this graph.
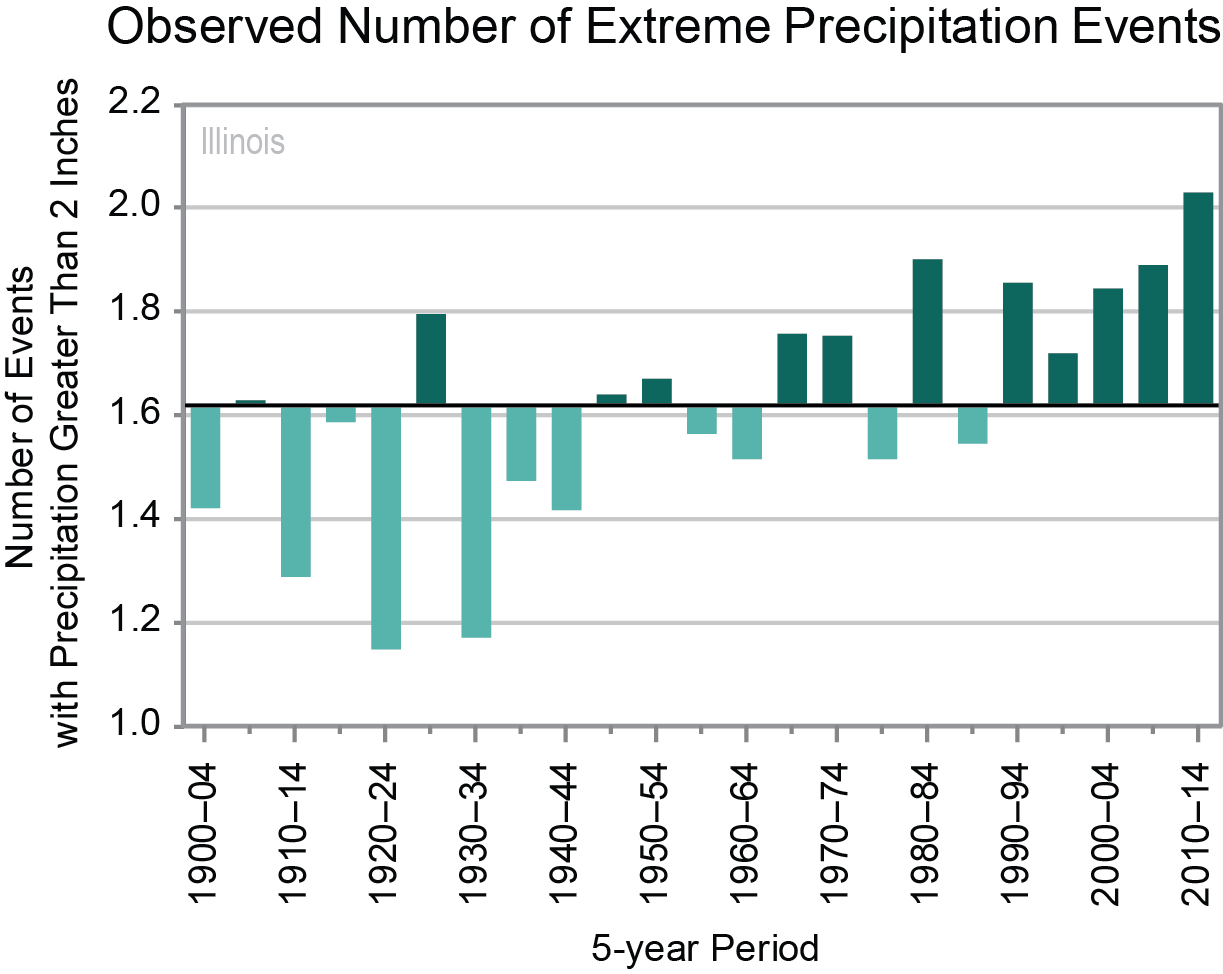
Furthermore, we have seen an increase in the number of extreme precipitation events over time. The graph below shows the observed number of days with extreme precipitation events (annual number of days with precipitation greater than 2 inches) for 1900–2014, averaged over 5-year periods; these values are averages from 43 available long-term reporting stations. A typical station experiences 1–2 such events each year. The number of extreme precipitation events has been above average since the 1990s. During the most recent 5-year period (2010–2014), Illinois experienced a record high number of events when stations averaged more than 2 events annually. The dark horizontal line is the long-term average (1900–2014) of 1.62 days per year.
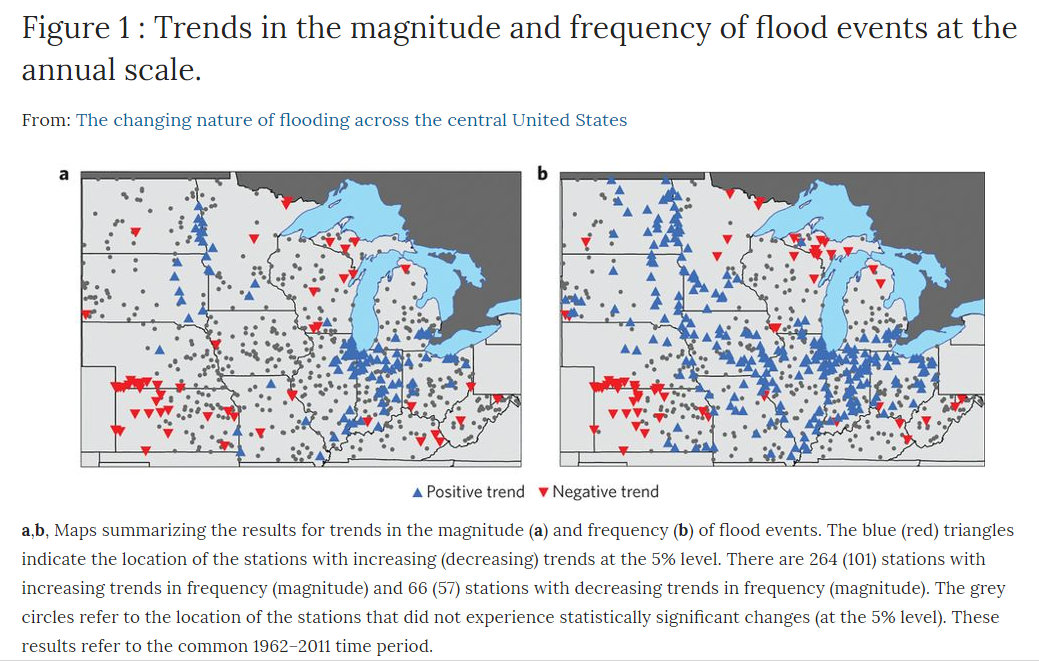
These trends in both annual precipitation and heavy rain events may have contributed to an increase in the frequency of flooding events in the Midwest, as shown by several studies, including this one in Nature. Below is the figure from the article showing a significant upward trend in the frequency of flood events throughout the Midwest (blue up arrows). I say “may have contributed” because flood frequency and magnitude can be affected by so many things such as land use, levees, and dams. Of particular concern in the Midwest is that extensive drain tile networks in cultivated fields may increase flooding as they rapidly convey water off the land and into rivers and streams.
The Good News
Weather forecasts have improved in the last 25 years. The forecast of precipitation amounts out to 7 days have been remarkably accurate, especially for large events. We are better able to monitor rainfall in real time with both rain gage and radar estimated rainfall. The hydrologic forecast models used by the NWS are much improved as well. We also have better two-way communication of forecasts, observations, and impacts. In 1993 the Internet was largely confined to universities, cell phones were brand new with limited coverage, and no one had smartphones.
The Bad News
Many of the lessons learned from the 1993 Flood have either been forgotten or ignored. Many of the decisionmakers from that event are long retired so the institutional knowledge is much diminished. In fact, here at the Water Survey, I am one of only three full-time employees left who actually worked through the event. Sally McConkey and Laura Kiefer are the other two. I am sure we will relearn the lessons of the Great Flood of 1993 during the next big flood and hopefully learn some new lessons as well.