

Temperature
The numbers are in and March 2016 was the 10th warmest March on record with an average temperature of 46.5 degrees, 5.2 degrees above normal. Illinois was not alone; essentially the entire US was warmer than normal in March (areas in yellow, orange, and red in the map below).
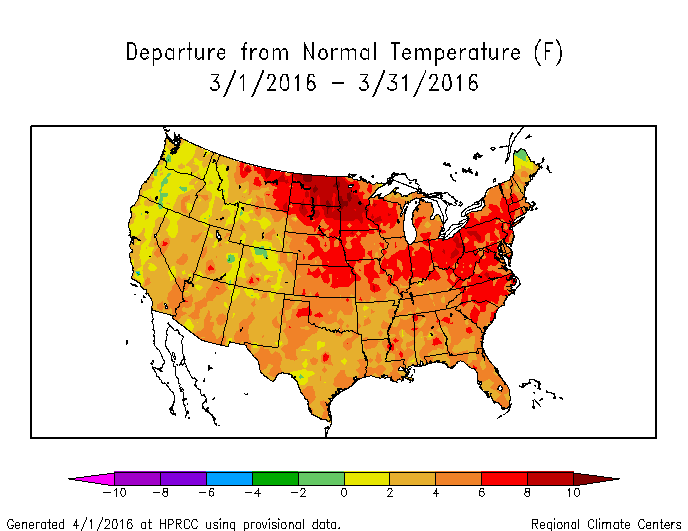
March is the latest in a string of above-normal months in Illinois going all the way back to September 2015. In fact, the September-March 2016 average temperature of 45.6 degrees is 3.9 degrees above normal and the 3rd warmest September-March combo on record. Those records go back to 1895.
This warmth for the past several months is due to the moderating influence of El Niño on winters in Illinois, as well as our trend towards milder winters in recent decades (the winter of 2013-14 being the exception to the rule).
Precipitation
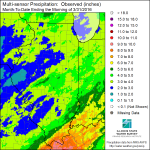
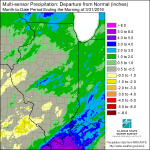
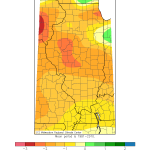
The statewide average precipitation was 3.28 inches, 0.32 inches above normal. Far southern Illinois was the wettest with amounts of 5 to 8 inches common. The largest monthly total in the state was Smithland Lock and Dam in Pope County with 8.73 inches. An area from Quincy to Peoria was the driest with amounts closer to 1 to 3 inches For example, the Quincy Airport reported only 1.08 inches of precipitation for March. Here are the observed precipitation and departure from normal for March (click to enlarge).
Snowfall
Northern Illinois experienced some snow in March while the rest of the state was quiet. Amounts of 1 to 4 inches were common in the north, and a few places along the IL-WI border received more. A site near Gurnee reported a monthly total of 8.2 inches of snow. Overall, snowfall was below-normal for March across the state.
Outlook for April
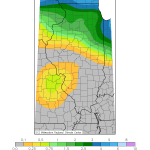
The NWS released their outlook for April on March 31. Illinois is part of a wide area with an increased chance of being warmer-than-normal, except for parts of northern Illinois. That’s not surprising given the trend in recent months. We have an increased chance of being drier-than-normal as well. Click to enlarge.

Normal refers to the 1981-2010 average and is used in many cases as the benchmark for comparing temperatures and precipitation.