

We are just wrapping up a 5-year USDA project called Useful to Usable (U2U), designed to provide a set of decision support tools for corn farmers. The tools can be found at www.agclimate4u.org, which redirects you to a server at Purdue University. Or you can just go directly to the tool here. I will be talking about the tools today at 3pm in Springfield at the Crowne Plaza Hotel for the Illinois Farm Bureau’s Governmental Affairs Leadership Conference 2016: “Change. Challenge. Opportunity.”
Tool Basics
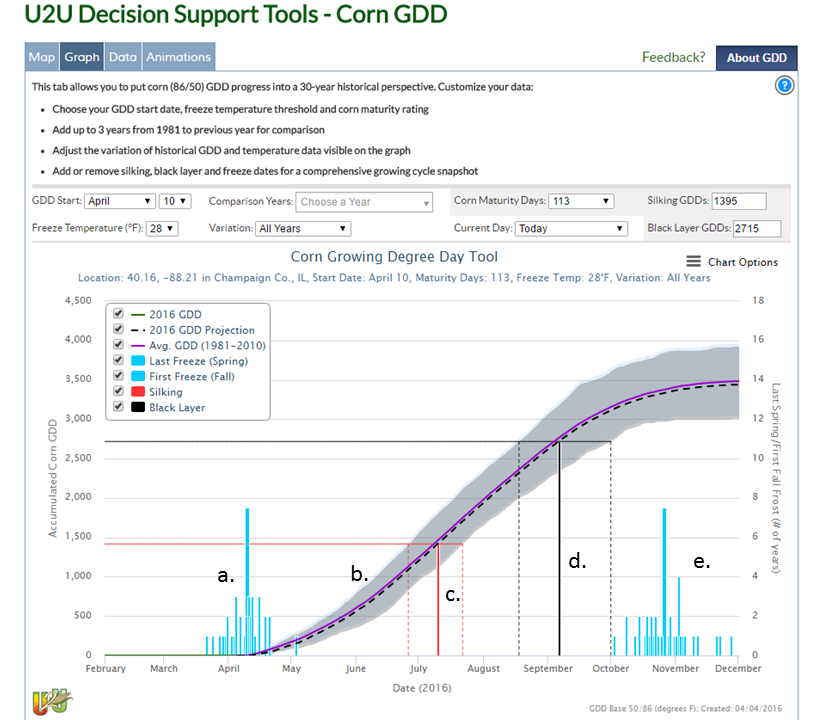
Once you go to www.agclimate4u.org, you can select on the tab labeled “Decision Dashboard” and on the next page select Corn GDD. Once there, you can click on the map or enter your zip/city/county and in a few seconds, you will get a Corn GDD graph that looks something like this. The figure caption explains the key components. This is just a screen shot, the actual tool is very dynamic and gives you more information when the mouse pointer touches a line. Everything in the control panel can be changed. Right off the bat, this graph tells you that if you plant on April 10 that you are probably at low risk for frost (blue bars) by the time the plants emerge. And you have plenty of time for the crop to mature before the fall frost risk (2nd set of blue bars).
Delayed Planting
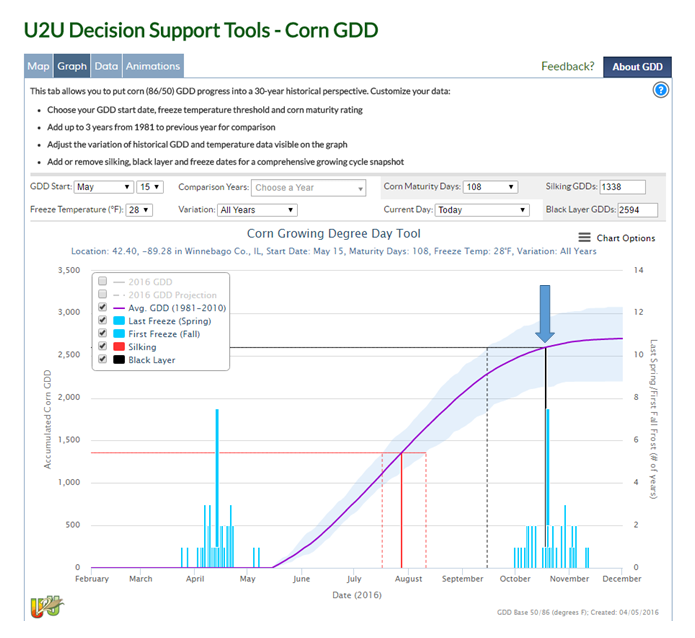
Let’s say you live in Winnebago County (where the growing season is a little tighter than in central and southern Illinois), and planting is delayed until May 15 because of wet weather. Using the historical average, the estimated date of reaching the black layer is right at the average date of the fall freeze (the tall, blue line), using the default hybrid’s days to maturity.
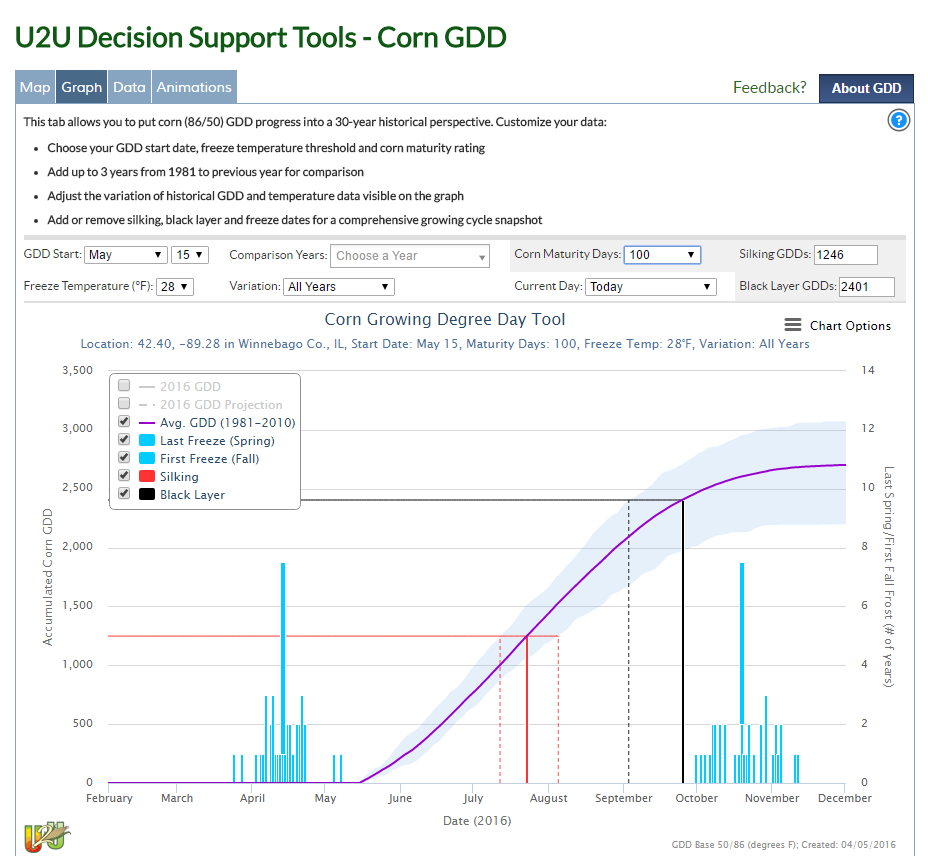
In this next figure, a shorter-season corn variety was selected, which results in the estimated date for the black layer being well ahead of the fall freeze dates. Besides using this as a tool for planting decisions, I will discuss next time the features for tracking Corn GDD during the growing season.
0 Replies to “Concerned about planting corn? There is a tool for that.”