At the national level, 2011 has become a very active tornado season. While the reports are preliminary, the number of tornadoes this year stands at 1189. And we are only five months into the year. At least 483 people have died this year, compared to 45 in 2010 and 21 in 2009.
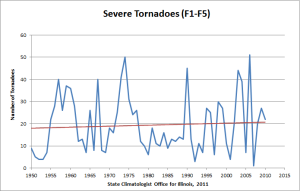
I’ve been asked by several people if there are any trends in the tornado records for Illinois. If we look at the number of stronger tornadoes since 1950 in Illinois, we see a lot of year to year variability. However there is no significant trend over time – either up or down (Figure 1). Stronger tornadoes are identified here as F-1 to F-5 events from 1950 to 2006 (using the Fujita Scale), and EF-1 to EF-5 events from 2007 to 2010 (using the Enhanced Fujita Scale). By definition, these stronger tornadoes cause at least a moderate amount of damage. See the Storm Prediction Center for a discussion on the original Fujita and Enhanced Fujita (EF) scales.

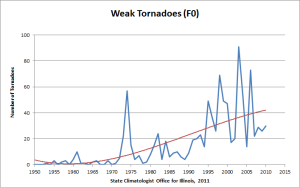
What we have seen is a dramatic increase in the number of F-0 (EF-0) tornadoes from 1950 to 2010 (Figure 2). These are the weakest of all tornado events and typically cause little if any damage. These events were overlooked in the early tornado records. The upward trend is the result of better radar systems, better spotter networks, and increased awareness and interest by the public. These factors combined have allowed for a better documentation of the weaker events over time.

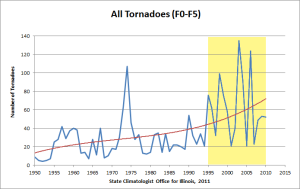
If we combine both data sets together, we see the apparent upward trend caused by the increasingly accurate accounting of F-0 (EF-0) tornadoes (Figure 3). As a result, the number of observed tornadoes in Illinois has increased over time, but without an indication of any underlying climate change.In my opinion, the tornado record since 1995 (shaded in yellow) provides the most accurate picture of tornado activity in Illinois. From that part of the record we see that the average number of tornadoes per year in Illinois is now 63.


Dr. Angel – If we use only the data from 1995 forward, how many years of data do you feel are needed before you would feel comfortable in determining a robust trend? Is there a standard to be applied or would it be based on your experience? Thank you in advance for an answer.
Just as a general observation it seems the Illinois data and the national data for severe tornadoes is similar to Illinois in showing no significant trend.
http://www.ncdc.noaa.gov/img/climate/research/tornado/tornadotrend.jpg
For detecting trends, I would prefer to have at least 30-40 years of data. You are correct in pointing out that there appears to be no trends in the more severe events.