The Kansas City NWS office posted this image showing that rivers have no measurable effect on tornado tracks.
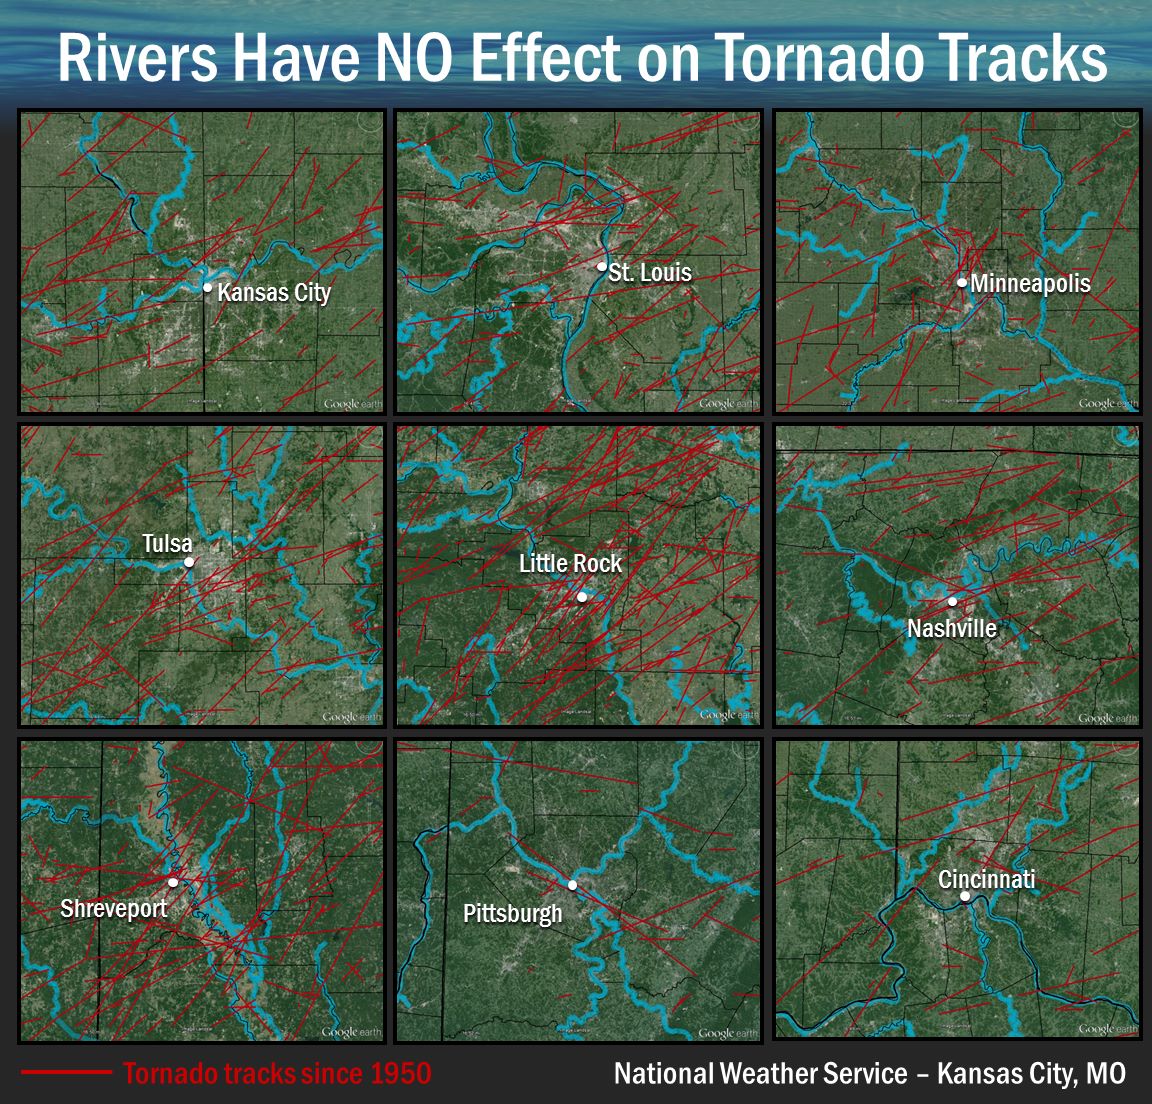
The case for St. Louis reminded me that one of the worst tornado disasters in US history occurred when a tornado tracked through St. Louis, jumped the Mississippi River, and continued doing damage in East St. Louis. That was May 27, 1896. Besides busting the myth about rivers, it busted the myth that tornadoes do not hit major cities. At the time, St. Louis had a population close to 500,000.
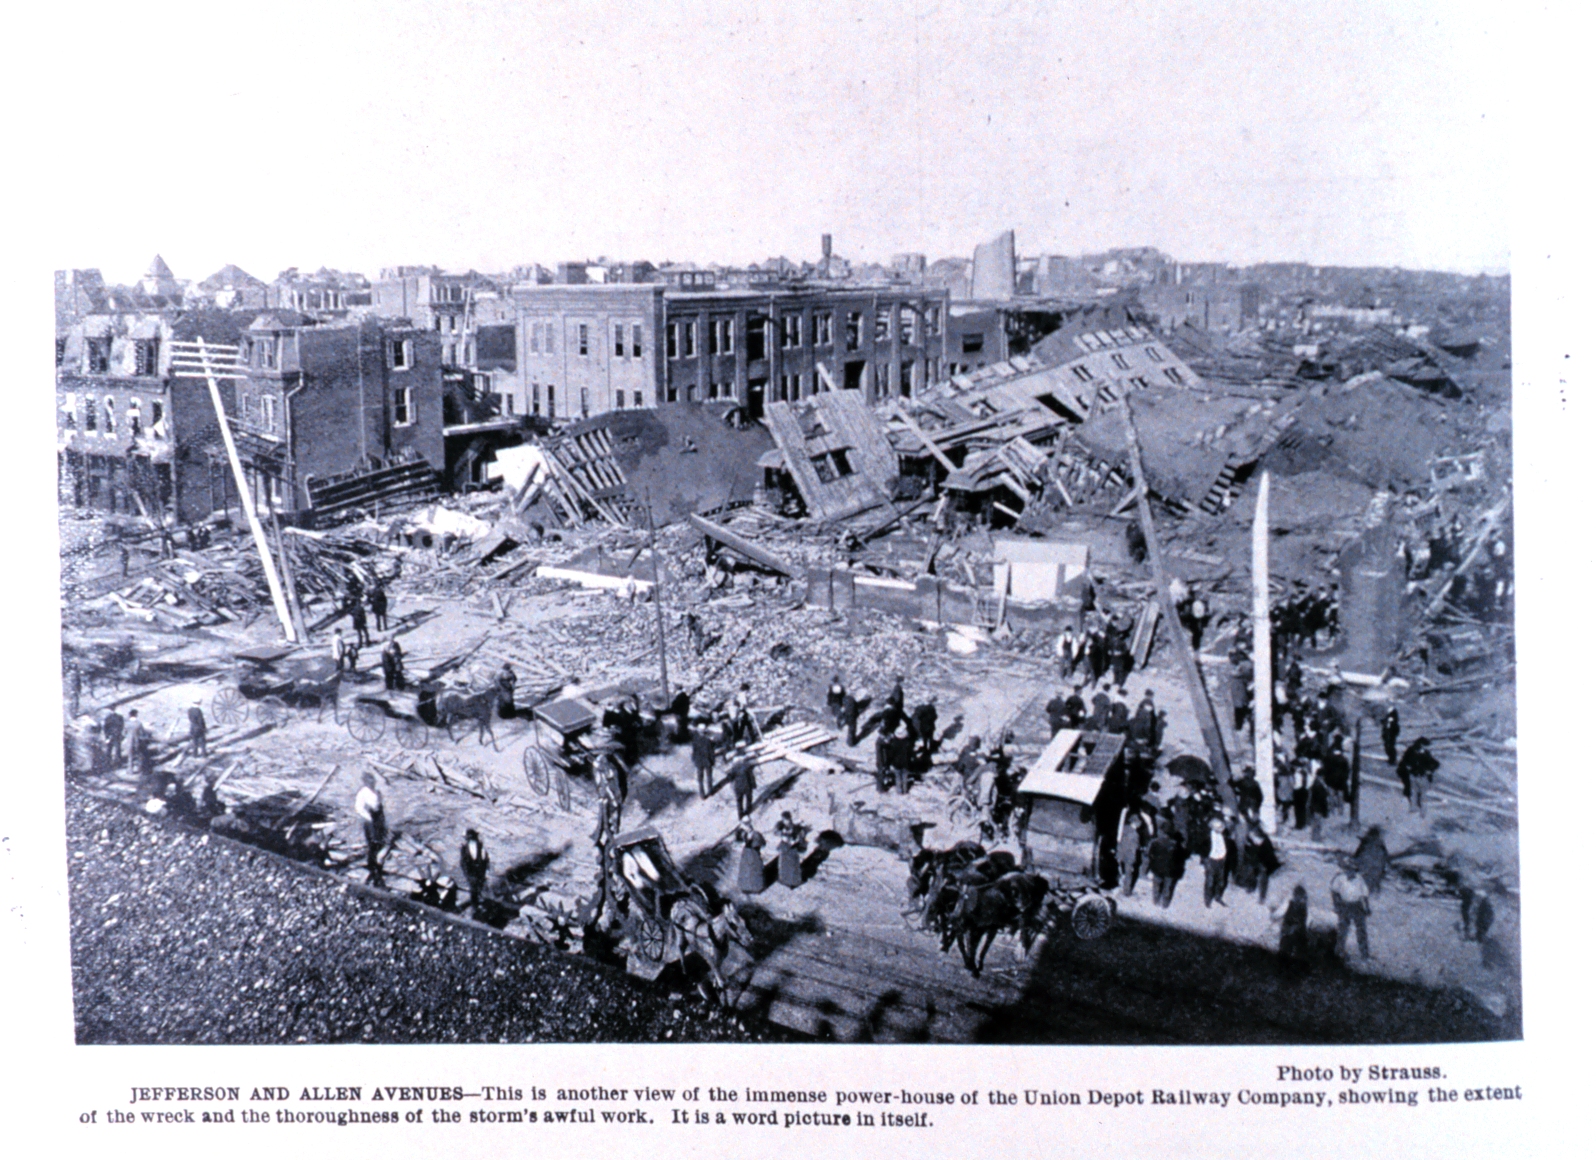
The St. Louis Public Library has a great collection of photos and newspaper articles on the event. A total of 255 people were killed in both Illinois and Missouri. It was estimated to be an F-4 tornado on the Fujita scale, based on the damage seen in photographs.
Nine days after the event, a book was published based on newspaper accounts with lots of photos. It has recently been reprinted by Southern Illinois University Press and called “The Great Cyclone at St Louis and East St Louis, May 27, 1896”. Besides the incredible amount of detail on the storm’s damage, you are treated to some vivid and lurid prose (which was the newspaper style of the day).
Example of the damage from the 1896 event.