Illinois in 2012 – Second Warmest and Tenth Driest on Record

2012 Summary

The year 2012 will long be remembered for the drought and the exceptionally warm temperatures. While the data for December is still preliminary, it was the second warmest and tenth driest year on record for Illinois.
The statewide average temperature for 2012 was 55.5 degrees, 3.3 degrees above normal and the second warmest year on record for Illinois. The warmest year was 1921 with 55.6 degrees. Temperatures were much warmer than normal in January-May, July, and December (figure below). For some places in Illinois it was the warmest year on record, including Chicago and Rockford (see story here).
The statewide average precipitation for 2012 was 30.37 inches. That was 9.83 inches below normal and the 10th driest year on record in Illinois. The normal annual precipitation in Illinois is 40.20 inches.  Precipitation was much drier than normal in May-July and November (figure below). Here is how 2012 compared with other dry years:

  1. 1901 – 26.34″
  2. 1930 – 27.88″
  3. 1963 – 28.00″
  4. 1953 – 28.05″
  5. 1914 – 28.58″
  6. 1976 – 28.84
  7. 1940 – 29.33″
  8. 1988 – 29.71″
  9. 1936 – 30.24″
  10. 2012 – 30.37″

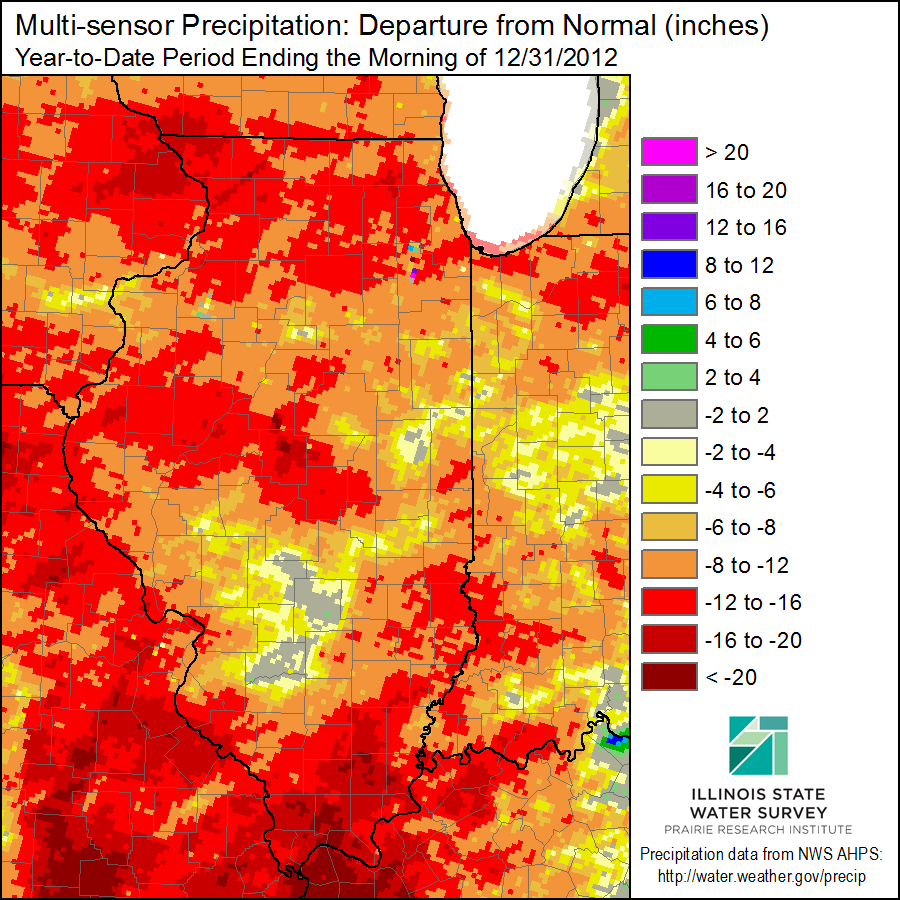
The map of the precipitation departures from normal across the state (below), as of December 31, 2012, shows large areas of the state with deficits in the range of 8 to 16 inches below normal (the darker tan and bright red colors) for 2012.
Unfortunately, winter is our driest time of year in Illinois.  The normal precipitation for January and February is 2.11 and 2.12 inches, respectively. Even March is not much wetter at 2.98 inches. That adds up to 7.21 inches for those three months combined. It would take something close to record precipitation in January (6.92 inches), February (4.46 inches), and March (7.53 inches), for a total of 18.91 inches, to erase the deficits accumulated in 2012.

December 2012

The statewide average precipitation for December 2012 was 2.34 inches, just 0.4 inches below normal.
The statewide average temperature for December 2012 was 35.8 degrees, 5.9 degrees above normal and the  13th warmest December on record. The warmest December on record was 1923 with 39.7 degrees.

Figures

image003
image008
Click to enlarge.

Cool, Dry November in Illinois

The statewide average precipitation for November was only 1.26 inches. That is 36 percent of normal or 2.21 inches below normal. It ranks as the 17th driest November on record since 1895. The maps below show the distribution around the state and how it compares to normal (1981-2010 average).
The statewide average precipitation from January to November was only 27.6, nearly 10 inches below the normal of 37.5 inches. What does this mean for the drought? The recovery that began in late August and through October in much of the state has stalled out.
The statewide average temperature for November was 40.8 degrees, 1.1 degrees below normal.
Image
Image

Latest Outlook for this Winter in Illinois

The NWS Climate Prediction Center posted their latest outlook for December and December – February (winter). The temperature outlook for December is for equal chances (EC) for above, below, and near-normal temperatures. The precipitation outlook for December is a little more interesting with an increased chance of above normal precipitation in the southern half of Illinois. The rest of the state is in the EC category.
There is not much to report on the December-February outlook for Illinois with the state in EC for both temperature and precipitation, except for an increased chance of above-normal precipitation in far southern Illinois.
Part of the reason for the bland outlooks is that the Climate Prediction Center expects near-normal temperatures in the eastern Pacific Ocean along the equator. That means there is no El Niño or La Niña expected for this winter.
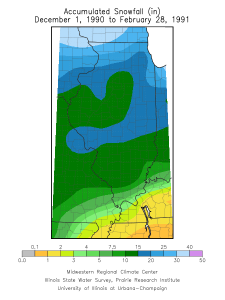
I looked at three winters that had a similar setup in the Pacific Ocean (slightly raised sea-surface temperatures but not a full-blown El Niño event). They are the winters of 1979-80, 1990-91, and 2003-04. In Illinois, each of these winter were slightly warmer than normal – on average by half a degree. Two out of the three had below-average precipitation (1979-80 was 2.2 inches short, 2003-04 was 1.3 inches short, while 1990-91 was 1.4 inches above).  All three had below-average snowfall in the north. However, two out of three had above-average snowfall in southern Illinois (1979-80 and 1990-91). See the maps below for more details on snowfall.

Climate Prediction Center outlook for December and December-February. Click to enlarge.

Winter 1979-80 snowfall. Click to enlarge.

Winter 1979-80 snowfall departures. Click to enlarge.

Winter 1990-91 snowfall. Click to enlarge.

Winter 1990-91 snowfall departures. Click to enlarge.

Winter 2003-04 snowfall. Click to enlarge.

Winter 2003-04 snowfall departures. Click to enlarge.

October in Illinois – Cool and Wet

October

October 2012 was cooler and wetter than normal in Illinois. The statewide average precipitation was 3.94 inches, 0.68 inches above normal. The wettest area of the state was between Quincy and Champaign where precipitation totals ranged from 4 to 7 inches. Some of the driest areas were in southern Illinois south of I-64 and in northern Illinois north of I-80. Some of that area had precipitation totals of less than 3 inches. See map below.
The statewide average temperature was 52.2 degrees, 1.9 degrees below normal. Most of the state reached lows of 32 degrees, and much of central and northern Illinois were down to 28 degrees, signalling the end of the growing season for most outdoor plants.

Year to Date

The statewide average precipitation for January-October was 27.1 inches, nearly 5.8 inches below average. This made it the 15th driest January-October and virtually tied with 2005. The driest was in 1901 with 21.99 inches. The second driest was 1988 with 22.10 inches.
The statewide average temperature was 58.9 degrees, 3.4 degrees above normal. That made it the second warmest on record. The warmest was 1921 with 59.2 degrees.
**All temperature and precipitation amounts are preliminary and may change as more data arrives.

October precipitation.

Year to date precipitation deficits. Areas east of St. Louis and in east-central Illinois have managed to erase the severe precipitation deficits from earlier in the year.