January – Wild Temperature Swings and Dry

Summary: January in Illinois finished out at 26.7 degrees, 0.3 degrees above average. Both precipitation and snowfall were below average. The statewide average precipitation (rain plus water content of snow) was 0.85 inches, 1.22 inches below average. Snowfall was below average across most of the state.

Temperature

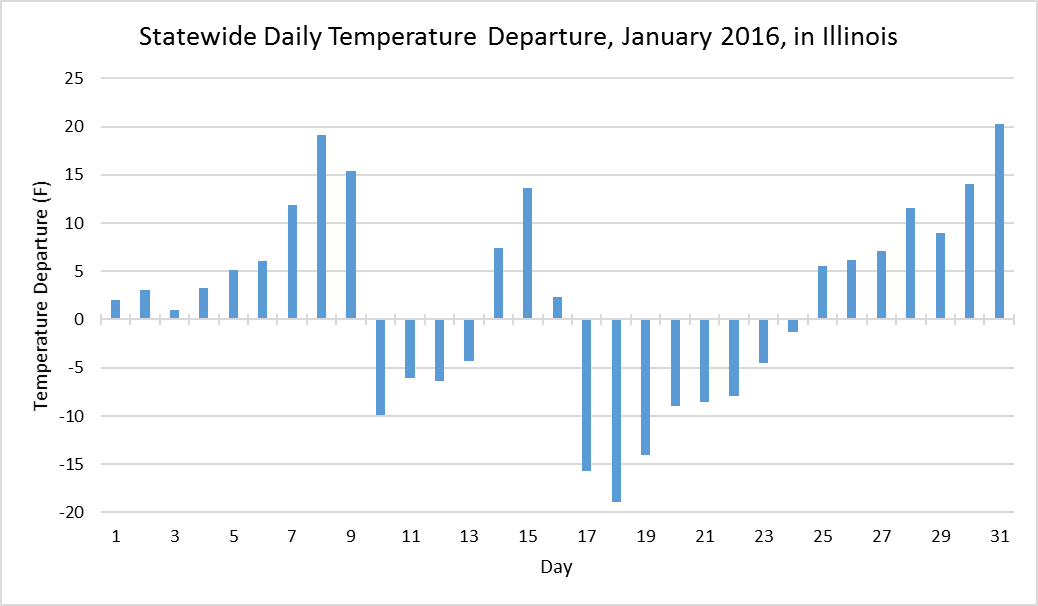
The temperatures in January in Illinois showed some very large swings that tended to cancel each other out in the end since we finished 0.3 degrees above average. The first 9 days were above average, followed by 4 days below average, then 3 days above average. The second half of January started out much below average, but steadily warmed and by the end of the month was 20 degrees above average.

While the magnitude of the swings were impressive, the pattern of warm and cold stretches is typical of winter in Illinois and represents the passage of warm and cold fronts across the region. Because it may take a day or more for a system to pass through Illinois, the dates and size of the temperature departures at a particular station may not correspond to the statewide numbers, especially in far southern Illinois.

image001

Precipitation

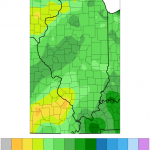
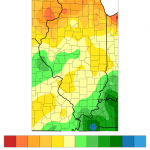
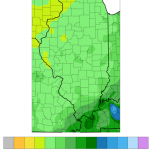
The January precipitation (left) and departures from average (right) show that precipitation was uniformly light across Illinois, just under an inch in most places (light green) and just over an inch below average (shades of yellow).

Snowfall

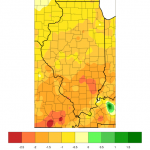
The January snowfall (left) ranged from 2 to 5 inches in most locations. Western Illinois saw 5 to 7.5 inches. However, as the panel on the right indicates most of Illinois received below-average snowfall (shades of beige and yellows).

October Warmer and Drier than Average in Illinois

October ended up warmer and drier than average in Illinois. The statewide average temperature was 55.8 degrees, 1.7 degrees above average.

The statewide average precipitation was 1.47 inches, 1.79 inches below average and the 22nd driest October on record. Even so, there were a few areas on the border with Iowa and Kentucky that received 2 to 3 inches of precipitation (dark blue in map below). The two largest monthly totals came from Stockton IL (COOP) and Orion IL (IL-HY-1), both reporting totals of 3.47 inches of precipitation.

IL-prcp-mpe-m2d-tot-20151031

The outlook for November, according to the National Weather Service, shows an increased chance for above-average temperatures across Illinois and the Midwest. The outlook shows an increased for above-average precipitation for the southern two-thirds of Illinois. This is part of broad area of expected wetter conditions across the southern US. Meanwhile, the northern third of Illinois has equal chances (EC) for above, below, and near-average precipitation.  Click on the maps to enlarge.

off15_tempoff15_prcp

Cool, Dry August and Sixth Wettest Summer in Illinois

August was cool across the state and dry in most places in Illinois, capping off a summer that was cool and wet.

Precipitation

The statewide average precipitation for August in Illinois was 2.95 inches, 0.64 inches below average.  However, this was followed by a very wet June with 9.44 inches, and a wet July with 4.84 inches. As a result, the summer precipitation total was 17.23 inches. That was 5.36 inches above average and the 6th wettest summer on record.

Here are the top ten wettest summer in Illinois. It was wetter than last summer and 2010, but nearly an inch away from the incredible summer of 1993.

Rank Year Total Departure % of Average
1 1993 18.51 6.64 156
2 1902 18.14 6.27 153
3 1981 17.62 5.75 148
4 1915 17.58 5.71 148
5 1958 17.53 5.66 148
6 2015 17.23 5.36 144
7 2010 16.24 4.37 137
8 1907 15.78 3.91 133
9 2000 15.26 3.39 129
10 2014 15.25 3.38 128

The precipitation for August was unevenly distributed, which is typical in the summer months. Amounts of 3 to 5 inches were common in northern Illinois and points east of St. Louis. Continue reading “Cool, Dry August and Sixth Wettest Summer in Illinois”

Illinois – Coolest Place to Live in 2014?

Illinois was one of the coolest places to live in 2014, at least in terms of temperature, according to the recent annual report released by the National Centers for Environmental Information (NCEI). In the map below, the areas in blue show areas where the temperatures were much colder than average for the central US and eastern Canada, while the West and Alaska were much warmer than average (areas in red).

Click to enlarge.
Temperature departures from the 1981-2010 average. Blue means colder than average while red means warmer than average. Click to enlarge.

According to the latest figures, the average temperature for Illinois in 2014 was 49.5 degrees, 2.7 degrees below the 1981-2010 average, and the 6th coolest year on record for Illinois.

Continue reading “Illinois – Coolest Place to Live in 2014?”