
 For much of Illinois April is typically the last month that we see freezing temperatures until Fall (at least we hope). Below are the maps showing the median dates when we see 28 and 32 degrees for the last time in Spring. The median represents the middle value in the range of dates and is less sensitive than the average to unusually early or late dates.
We have more discussion and maps, including the earliest and latest dates of freezes during the 1981-2010 period on our frost webpage.
In addition you can track the status of this spring (2013) in terms of how things stand on hitting 28 and 32 degrees from the Midwestern Regional Climate Center.


March Off to Cold, Wet Start
So far, March has been both colder than average across all of Illinois and wetter than average across western and northern Illinois. The statewide temperature for March 1-14 was 32.5 degrees, 5.4 degrees below average. That stands in stark contrast to last March when the statewide temperature for March 1-14 was 45.2 degrees, 7.3 degrees above average. That is a 12.7 degree difference between the two periods.
Precipitation through the morning of March 15 (Figure 1) ranged from less than an inch in southern Illinois to over 2 inches in western Illinois. Precipitation was below average in southern and eastern Illinois (Figure 2) and above average in western and northern Illinois. The dryness in southern and eastern Illinois is not a major concern at this point because of wet conditions in those areas in January and February.
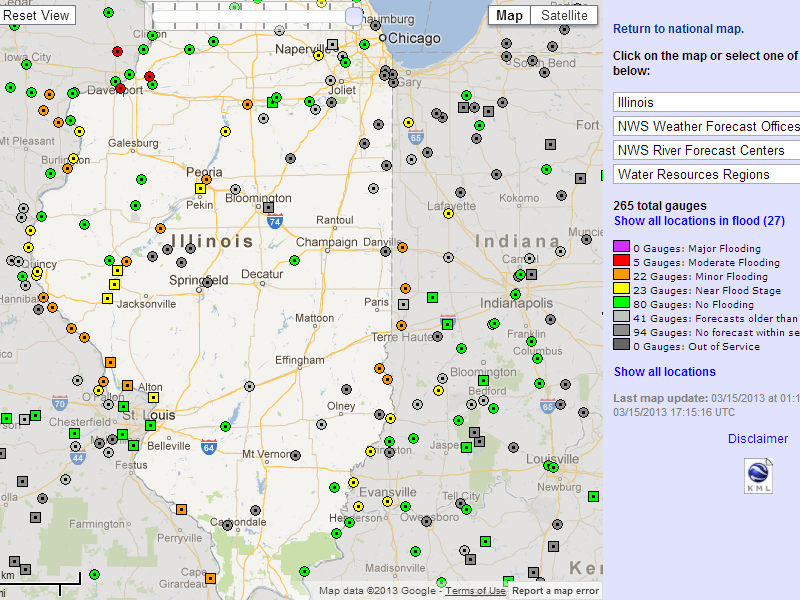
The latest NWS forecasts show that rains of 1 to 2 inches or more could fall in the southern third of Illinois over the next five days (Figure 3). Also their 6-10 day and 8-14 days forecast show that colder and wetter than average conditions will prevail for the rest of March. Because of recent rains and melting snow, the NWS has issued flood warnings today on portions of the Mississippi, Illinois, and Wabash Rivers (Figure 4).


Winter Finally Arrives in Illinois In February
February
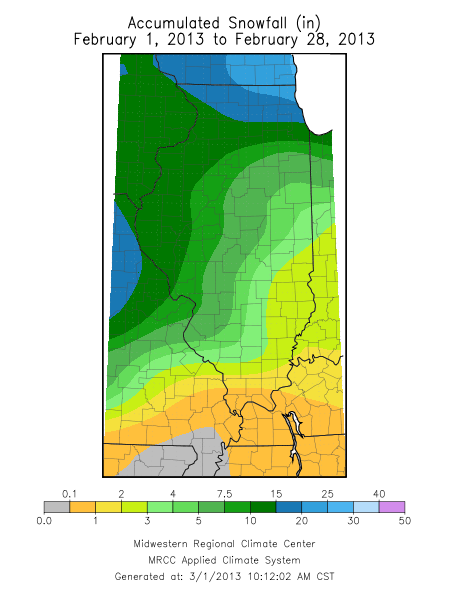
The preliminary numbers are in and winter finally arrived in February. The statewide temperature for February finished at 29.3 degrees, which was 1.5 degrees below average. The statewide precipitation was 2.7 inches, which was 0.6 inches above average. The precipitation total represented both rainfall and the water content of any snow. Snowfall for February ranged from less than an inch in southern Illinois to over 20 inches in the far northeast corner of the state.
Winter
For the core winter months of December, January, and February, the statewide temperature was 31.8 degrees, which was 2.8 degrees above average. The statewide average precipitation was 9.1 inches, 2.2 inches above average. It was the 11th wettest winter on record for Illinois. Snowfall for those three months ranged from less than 10 inches in east-central Illinois to over 20 inches in parts of far western and northern Illinois, as well as in a band across southern Illinois.
Maps
Here are the maps of precipitation and snowfall for February.


Latest Monthly and Seasonal Outlook Released
Yesterday NOAA’s Climate Prediction Center released their outlooks for February and beyond (see maps below). For February they call for an increased chance of below-average temperatures for the upper Midwest, including the northern two-thirds of Illinois. Precipitation in Illinois is expected to have equal chances (E.C.) of being above, below, or near average.
For February through April, temperatures have an equal chance of being above, below, or near average. It’s what I call a neutral forecast. On the other hand, there is an increased chance of above-average precipitation across the Great Lakes region, including the northern three-fourths of Illinois. That would be great news for the further recovery of drought conditions in Illinois, if it pans out.
The outlook for May through July indicates that a large part of the US is expected to have an increased chance of above-average temperatures (last map). The precipitation outlook for this period is neutral.
The outlook for August through October (not shown) is not very interesting for Illinois with equal chances of above, below, and near average temperature and precipitation. In other words, it is a very neutral outlook.
As of January 18, this month has been warm and wet. Temperatures have been almost 5 degrees above the long-term average. Precipitation, mostly in the form of rain, has ranged from less than an inch in northwest Illinois to over 5 inches in far southern Illinois. Current measurements of soil temperatures in Illinois show that the soils under grass at 4 inches remain unfrozen. So much of that rain and melted snow should have soaked in.

