June in Illinois – Warmer and Wetter Than Average

The statewide average precipitation for June 2014 in Illinois was 6.78 inches, 2.58 inches above average and the 8th wettest June on record. The wettest June on record was 1902 with 8.27 inches. Four out of the last five June’s have been wetter than average in Illinois:

  • 2010: 7.71 inches, 3.51 inches above average
  • 2011: 6.69 inches, 2.49 inches above average
  • 2012: 1.73 inches, 2.47 inches below average
  • 2013: 5.33 inches, 1.13 inches above average
  • 2014: 6.78 inches, 2.58 inches above average 

The statewide average temperature for June 2014 in Illinois was 72.9 degrees, 1.1 degrees above average.

Here are the maps of accumulated rainfall in June, 2014, as well as the departure from the 1981-2010 average. The rainfall was widespread across the state, and above-average as well. The area with the highest departures was the northwest corner of the state. There were 13 stations with 10 or more inches of rain in June. The wettest was Galena with 12.42 inches of rain for the month.

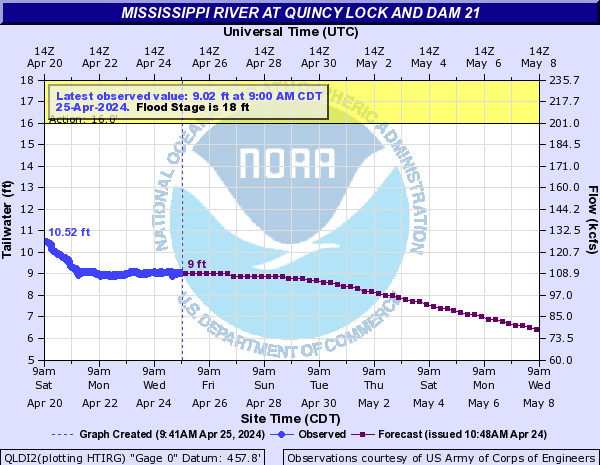
Much of the Corn Belt was wetter than average for June (last map) with precipitation departures from average in the range of 6 to 10 inches. That’s more than double the average in many locations. The results are high flows on many rivers and streams and flooding along the main stem of the Mississippi River south of Dubuque, IA.

fig1
Click to enlarge.
fig2
Click to enlarge.
fig3
Click to enlarge.

Friday Roundup in Illinois

It is no surprise that June has turned into a wetter-than-average month. The statewide precipitation in Illinois is sitting at 6.1 inches, 1.9 inches above average. Several locations in central and northern Illinois have reported rainfall totals in the 8 to 10 inch range. Two of the highest so far are Dixon (IL-LE-17) with 10.15 inches and Galena (IL-JD-2) with 10.12 inches. We will have the final statistics on June next week.

As the map below shows, areas in green and blue are in the 5 to 12 inch range, and are common across central and northern Illinois, as well as northern Missouri, Iowa, Minnesota, southern Wisconsin, and parts of Indiana.

MonthPDataMRCC

Of course, lots of rain means lots of runoff and flooding. Most of the rivers and streams in Illinois and the Midwest are having relatively high flows, shown by this USGS map. The green dots show flow in the normal range, blue dots indicate above normal flow, and black dots are record flows for this date.

USGS WaterWatch    Streamflow conditions


Finally, the Chicago area has not only struggled with heavy rainfall events that have caused flooding in June, but they have had an unusually high number of days with fog. Here is the web page from the Chicago NWS office explaining what is going on with this fog.

densefog
Click to go to original NWS article on the not so rare summer fog.


Flood Risk on the Illinois and Mississippi Rivers

Mississippi River at Quincy, IL, on May 26, 2013.

The heavy rainfall across the Midwest in recent weeks has increased the risk of flooding on the Illinois and Mississippi Rivers. Rainfall totals were highest in western Illinois, northern Missouri, much of Iowa, southeastern Minnesota, and western Wisconsin, and ranged from 6 to 12 inches in the last 30 days. See the MRCC map below.
The National Weather Service produces forecasts of river levels based on current conditions and precipitation over the next 24 hours. At Quincy Lock and Dam, the Mighty Mississippi River is expected to be in “major” flood by sometime Thursday (first graph). See the latest forecast for this site here.
It is a similar story on the lower Illinois River. The current and forecasted river stage at Hardin, IL (second graph) shows that the river will reach “major” flood stage by next Monday. See the latest forecast for this site here. Of course, more rainfall in coming days will change these forecasts.

Mississippi River at Quincy Lock & Dam 21
Illinois River at Hardin

April 4th Wettest On Record

Precipitation

This April was the 4th wettest on record for Illinois with 6.90 inches, based on the preliminary numbers. That was 3.13 inches above the long-term average of 3.77 inches.
To show you how wet it was, this April easily beat out the combined statewide rainfall totals for Illinois in May, June, and July of 2012 during the worst of the drought. The total rainfall for those months in 2012 were 2.50 inches, 1.80 inches, 1.48 inches, respectively, which led to a total of only 5.78 inches. That was 1.12 inches less than this April!
The first map below shows the spectacular rainfall totals across much of the state. The areas in yellow and orange were 6 to 9 inches. A few areas in pink and red were 9 to 11 inches. This product has a 4 kilometer resolution and is based on radar estimates calibrated with rain gauges.
The second map shows the same rainfall amounts expressed as a percentage of the long-term average. There was a small patch of below-average rainfall in far southern Illinois. Otherwise the rainfall across the rest of the state was much above average. Many areas in the dark blue were 2 to 3 times their long-average rainfall.
Speaking of rain gauges, the two largest monthly totals for April so far were Augusta with 12.28 inches and Naperville with 11.03 inches. Several more stations reported totals in the 10-inch range.
There were two major impacts of the wet April. One was widespread flooding on the Illinois, Wabash, and Mississippi Rivers and their tributaries. Several sites along the Illinois reported record high river crests in April. Because the flooding included the Chicago area, the dollar damages and number of people affected will be quite large.
The second impact of the wet April was the delay in fieldwork. In the April 29 USDA NASS report, only 1 percent of the corn crop was planted, compared to 76 percent last April, and a five-year average of 36 percent.

Temperature

The statewide average temperature was 50.1 degrees and 2.3 degrees below average. That was not record-setting but reflects the fact that we had a lot of cool, cloudy days in April.

Figures

The April 2013 precipitation, ending with reports on the morning of May 1. Click to enlarge.
April 2013 precipitation, ending with reports on the morning of May 1. Click to enlarge.

April precipitation, expressed as a percent of the long-term average. Click to enlarge.
April precipitation, expressed as a percent of the long-term average, for reports ending on the morning of May 1. Click to enlarge.