April Already 4th Wettest on Record

Based on preliminary data, this April in Illinois is already the 4th wettest on record with 6.58 inches of precipitation. Average statewide precipitation for April is 3.77 inches. So we are already almost two inches above average.
According to the NWS forecast, more rain is expected across southern Illinois on Friday and Saturday. Therefore, it is possible that we will move up the list by the end of the month. In addition, some sites may have already reached their record for April, including the city of Chicago.

Top 5 Wettest Aprils

  1. 2011 with 7.40 inches
  2. 1957 with 7.13 inches
  3. 1927 with 6.95 inches
  4. 2013 with 6.58 inches
  5. 1944 with 6.50 inches

Precipitation Pattern Across the State

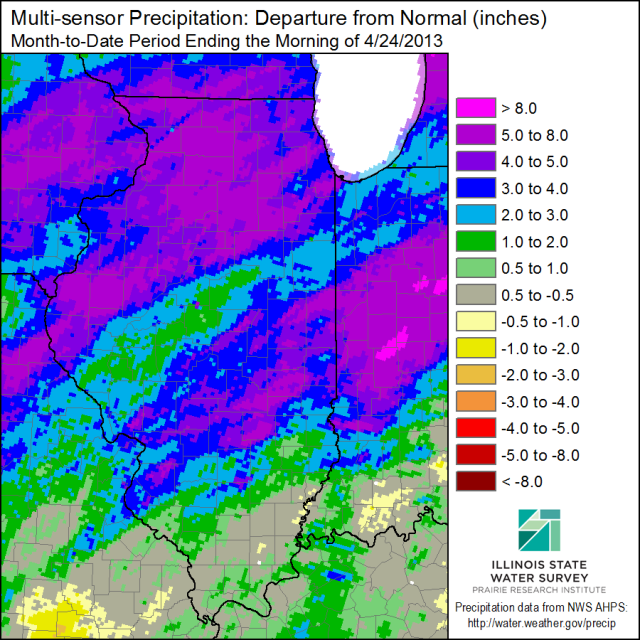
Here is how the precipitation has been distributed around the state, based on our multi-sensor precipitation product, with the actual amounts and the departures from average. Many parts of central and northern Illinois have more than double their average April precipitation (shades of purple in the second map).
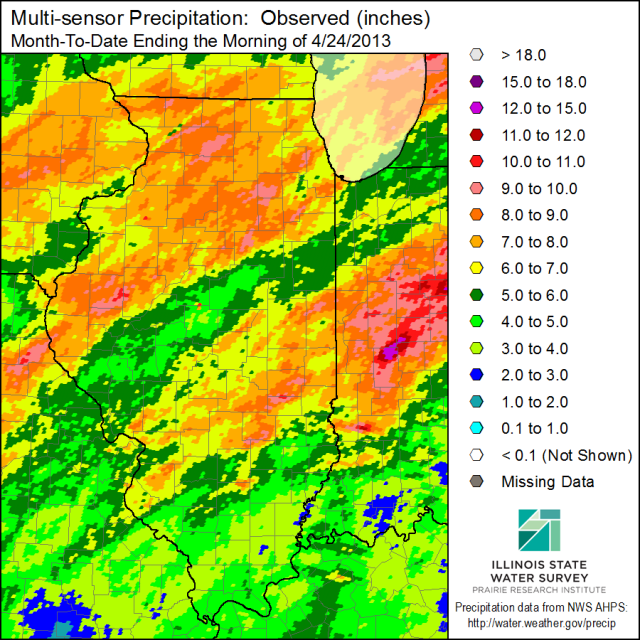
April precipitation in inches for the first 24 days of the month. Click to enlarge.

April precipitation as departures from average. Click to enlarge.

Heavy Rains of April 18-19, 2013

Northern and central Illinois saw widespread heavy rains on April 18-19, 2013. As a result, widespread flooding occurred first at the local level and then along major rivers by the weekend. Last year we had the drought; this year we have what I’m calling the “anti-drought”.
Below is the multi-sensor precipitation map for the 7-day period ending April 19, 2013. This map is based on radar-estimated precipitation and calibrated using available raingauges. Some of the heaviest rains fell north of a line between Quincy and Kankakee. Areas in purple reported between 6 and 8 inches, while the areas in the two shades of red were between 4 and 6 inches. Areas to the south of Interstate 70 escaped the heavier rains.
The second map is the precipitation situation for the year to date, expressed as a percent of “normal” or long-term average. The entire state is above average with the percentages getting larger (wetter) northward. In general, I would characterize the southern third of the state as being 110 to 150 percent of average so far. The central third of Illinois is between 150 and 200 percent of average and the northern third is between 200 and 300 percent of average.
The last figure is a photo that I took on my commercial flight from Chicago to Champaign on Thursday afternoon, just after the worst of the rain had fallen. It is not the best photo in the world because it was gloomy, foggy, and the flight was rough. But it does show how saturated the fields were at this point.
IL-prcp-mpe-007-tot-20130419
IL-prcp-mpe-y2d-pct-20130419

photo
Picture of flooded farm fields somewhere between Chicago and Champaign Illinois on Thursday afternoon (April 18). It’s not the best picture in the world , but I took this out the window of the airplane while flying through moderate turbulence. You can see the water standing in fields and how small creeks were transformed into rivers. Click to enlarge.

How Much Rain Do We Need to End the Drought

[Updated July 20 for a more frequently updated map from the Climate Prediction Center]
People have asked me several times this week, “how much rain do we need to end the drought?”
There is no easy way to answer this. The normal rainfall per week in Illinois is about an inch. So we need that inch per week just to keep from slipping farther behind. Taking it a step farther, that means you need well over an inch per week to start recovering from drought. Of course, no amount of rain at this point will undo the damage done to crops already.
There is one product, based on the Palmer Hydrological Drought Index, that attempts to answer this question from the Climate Prediction Center. However, I would treat it as an estimate. Even so, it gives you an idea of how far we have to go for a recovery. They estimate that we would have needed 9 to 15 inches of rain across much of Illinois to end the drought. That is a tall order. The wettest July on record for Illinois is 8.03 inches in 1958 and the wettest August on record was 6.91 inches in 1977.
Personally, I’m not sure it would take record-breaking rainfall. And I’m not sure we want 9 to 15 inches over the course of one or two months because that could lead to all kinds of other problems like flooding and heavy soil erosion.
Based on past droughts in Illinois, a month with rainfall 50 percent above normal (around 6 inches) followed by several months with near-normal rainfall would be capable of turning things around without the more serious consequences of heavy rainfall.

Extreme Weather Year in the US

This year has been noteworthy for the number of extreme events across the U.S. In fact, we have had 12 disasters that have exceeded $1 billion in losses each in 2011. We also experienced some $50 billion in total losses for the year. And that is with a fairly quiet hurricane season. Some of those billion dollar disasters had direct impacts on Illinois, including the February blizzard, and the spring flooding.
You can read more about the major disasters this year at http://www.noaa.gov/extreme2011/
NOAA is promoting a new concept called a “Weather Ready Nation”. The idea is to be better prepared and to better respond to weather/climate disasters. This involves better forecasts, better dissemination of forecasts, and closer working relationships among federal, state, and local partners. I’m sure we will hear more about this in coming months.
[Update: The method used to generate the bar-plot part of this graph is apparently flawed. While the line plots show both actual damages and damages adjusted for the Consumer Price Index, they did not make a similar adjustment on the number of 1 billion dollar event. As a result, the number of 1 billion dollar events will climb as prices climb (for example, the destroyed $100k home in 1980 would be worth $250k in 2011). See http://rogerpielkejr.blogspot.com/2012/01/bad-economics-at-noaa.html.]

Click to enlarge.