A couple of weeks ago the NOAA Climate Prediction Center issued a La Niña advisory, which indicates that La Niña conditions were observed during the month of August and have a 75% chance to continue through climatological winter (December – February). Information on the advisory and a more diagnostic discussion can be found here: https://www.cpc.ncep.noaa.gov/products/analysis_monitoring/enso_advisory/ensodisc.shtml.
La Niña refers to one phase of the El Niño-Southern Oscillation or ENSO, the interaction between the ocean and atmosphere in the tropical Pacific that results in variations in sea surface temperatures, air temperatures, and precipitation. Because of the importance of the Pacific Ocean in the global climate, ENSO not only affects tropical climates but also climates of regions outside of the tropics, including here in the Midwest.
The following websites contain more deailed information on La Niña and ENSO more generally.
NOAA Climate.gov: https://www.climate.gov/enso
Columbia University: https://iridl.ldeo.columbia.edu/maproom/ENSO/ENSO_Info.html
North Carolina Climate Office: https://climate.ncsu.edu/climate/patterns/enso
Typical La Niña Winter
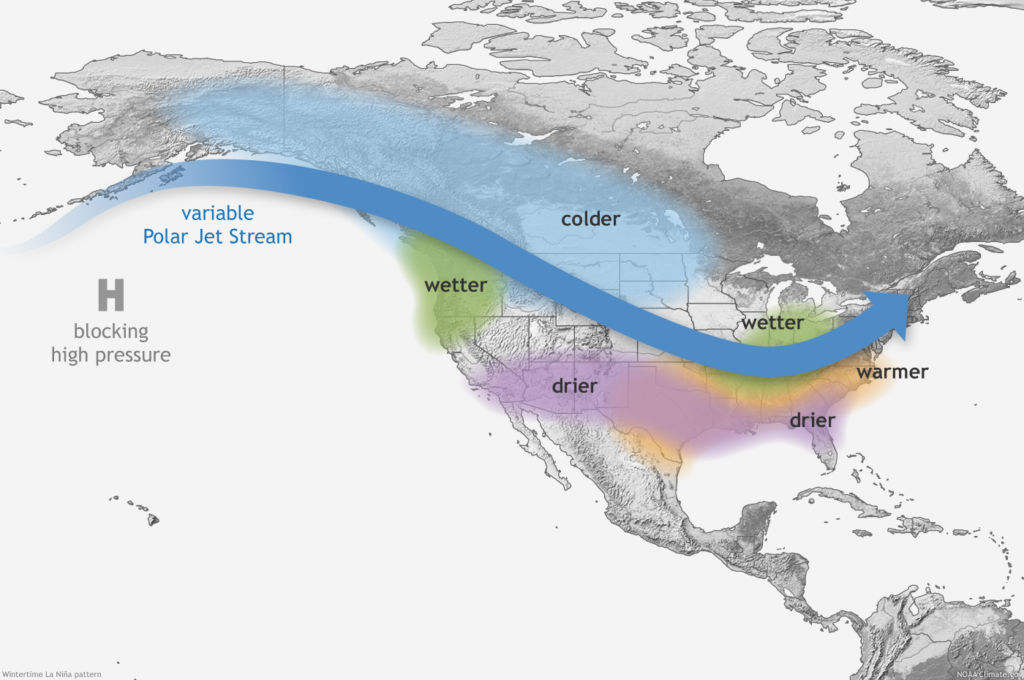
Ocean-atmosphere interactions modulated by ENSO can modify atmospheric circulation and affect remote climates, including the Midwest. These impacts are typically largest in climatological winter. The graphic below shows the typical La Niña impacts to winter climate across North America. La Niña winters tend to be wetter than average in the eastern Midwest, particularly in the Ohio Valley, whereas they tend to be colder than average in the northwest Midwest.
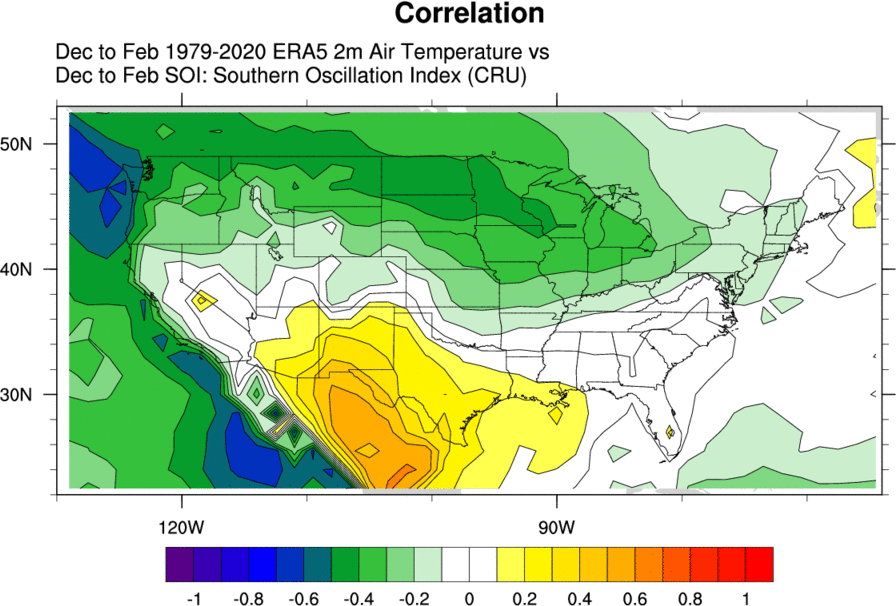
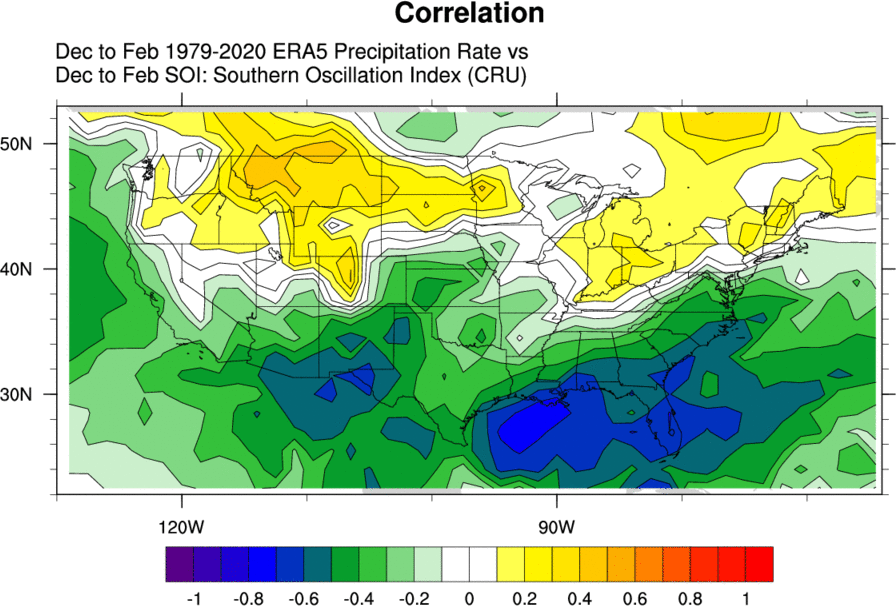
The maps below show a different perspective on the impacts of La Niña on Midwest Winter climate. Specifically, the maps show the correlation between temperature/precipitation and the Southern Oscillation Index, a common indicator of ENSO conditions that is based on the observed sea level pressure differences between Tahiti and Darwin, Australia. Positive SOI values typically coincide with La Niña conditions. The top map shows correlations between SOI and winter air temperature across the U.S. The areas shaded in green exhibit a negative correlation between SOI and temperature, meaning that La Niña winters in these areas tend to be colder than average. The bottom map shows correlations between SOI and winter precipitation across the U.S. In this case, the eastern half of Illinois is shaded yellow, indicating a positive correlation. This suggests that La Niña winters tend to be wetter than average in northern and eastern Illinois.
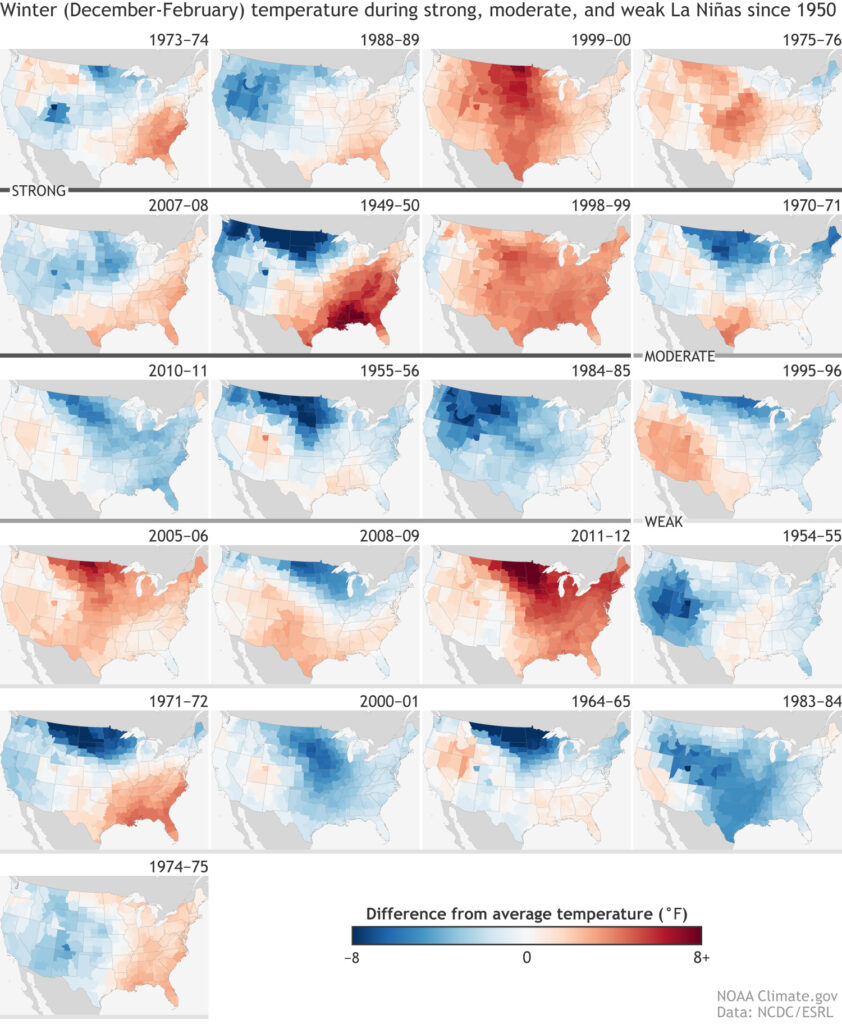
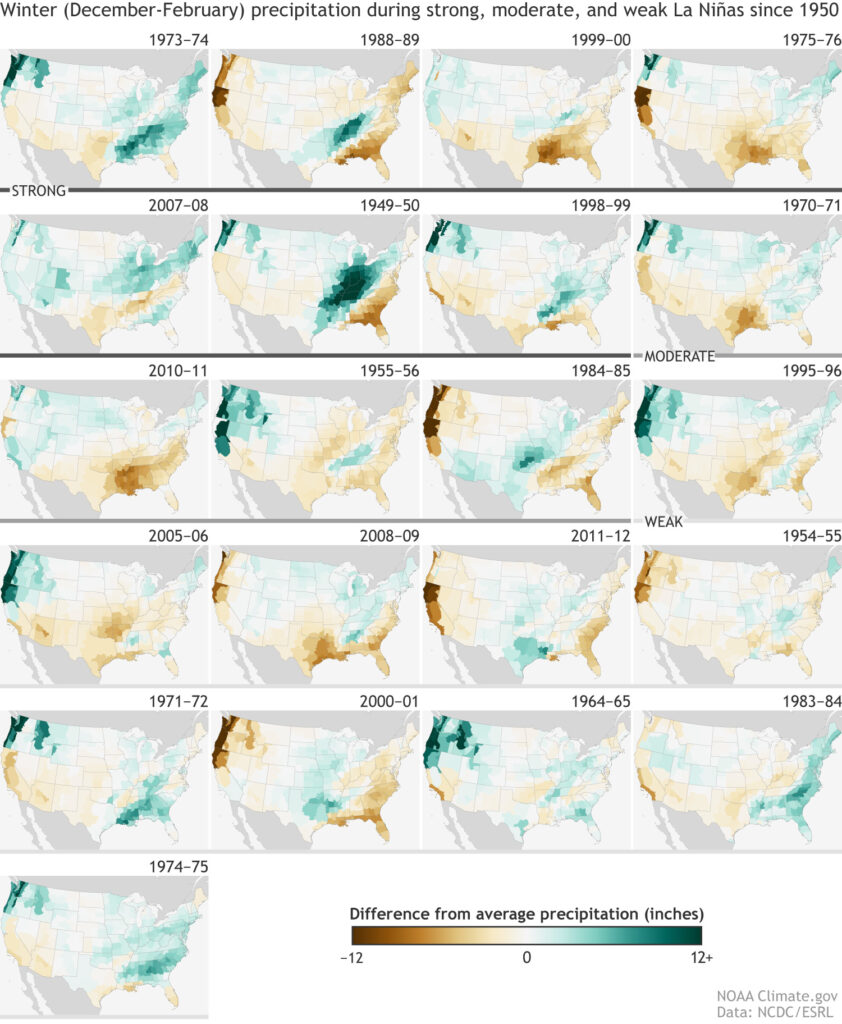
The previous maps imply La Niña winters in Illinois tend to be colder and wetter. However, ENSO is only one of many features that influence winter weather in Illinois. Other impactful features include sea surface temperature and sea level pressure in the north Pacific, temperatures and sea ice extent in the Arctic, and long-term trends in both winter temperature and precipitation. The maps below are taken from NOAA’s Climate.gov website and show winter temperature and precipitation anomalies across the U.S. during every La Niña since 1950. Although most La Niña winters tend to be wetter than average in Illinois, we have also experienced drier than average La Niña winters as well.
Fall to Winter Outlooks
ENSO is an important part of seasonal climate forecasting, and the latest outlooks from the Climate Prediction Center are influenced by ongoing La Niña, while also showing influence from long-term trends and current soil moisture conditions. One-month outlooks show elevated odds of both warmer than drier than normal conditions in October.
The three-month outlooks show continued elevated chances of warmer than normal conditions, but equal chance of above, below, and normal precipitation for the period October through December.