The preliminary statewide average September temperature was 66.8 degrees, 0.6 degrees above the 1991–2020 average and the 57th warmest on record going back to 1895. The preliminary statewide average total September precipitation was 2.66 inches, 0.53 inches below the 1991–2020 average and the 41st driest on record statewide.
Data are provisional and may change slightly over time.
A Mostly Mild September
September followed August’s lead and brought mostly mild temperatures across the state. As the temperature departures from Jacksonville in Figure 1 show, the only prolonged warm period last month was in the third week, when temperatures were 5 to 15 degrees above normal. A cold front swept through Illinois around the fall equinox and brought much cooler, fall-like weather to wrap up the first month of climatological fall.
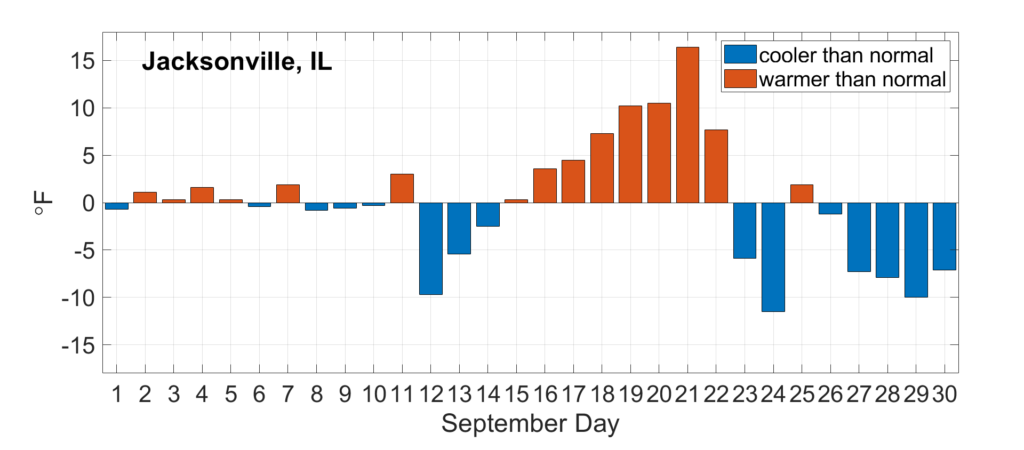
During the hot week in the third week of September, high temperatures reached into the mid- to upper 90s across the state. Among the very high temperatures was 99 degrees observed in Carbondale on Sept. 21, tied with 1940 and 1955 for the second latest 99+ degree temperature on record in Carbondale.
However, the cold front that moved through the state around Sept. 21 brought much cooler, drier air into the region. Nighttime low temperatures in the final week of the month regularly dipped into the upper 30s and low 40s. A few stations even reached the 32-degree mark in the last week of September, including the 19th earliest first fall freeze on record in Normal.
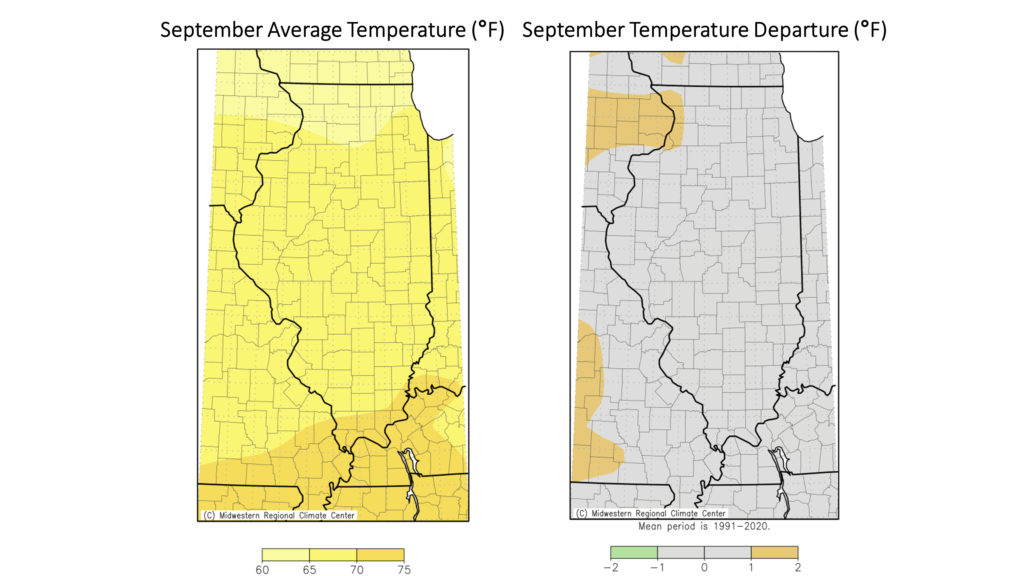
September average temperatures ranged from the low 60s in northern Illinois to the low 70s in southern, within 1 degree of normal statewide (Figure 2). The warmest place in the state last month was Bean Ridge in Alexander County with an average September temperature of 72.8 degrees. The coolest place was Stockton in Jo Daviess County with an average September temperature of 63.0 degrees.
Daily high maximum temperature records were broken last month at 27 stations, and daily high minimum temperature records were broken at 5 stations. Daily low maximum temperature records were broken last month at 4 stations, and daily low minimum temperature records were also broken at 4 stations.
Overall, the preliminary statewide average September temperature was 66.8 degrees, 0.6 degrees above the 1991–2020 average and the 57th warmest on record going back to 1895.
Drier Start to Fall
Early to mid-September brought multiple rounds of isolated, heavy precipitation to parts of northern, western, and east-central Illinois. However, significant rainfall eluded most of southern and northeastern Illinois in the first two-thirds of the month. Meanwhile, the final 10 days of the month were cooler and very dry statewide. The result was a much drier than normal September for most of southern and northeastern Illinois and near normal to slightly wetter than normal conditions in parts of northern and west-central Illinois (Figure 3). Specifically, total precipitation last month ranged from over 6 inches in parts of western and northern Illinois to less than 1 inch in far southern Illinois. Smithland Lock and Dam in Pope County recorded only 0.60 inches of rain last month, making it the fourth driest September since 1980 there.
Among the driest points in the state in September was Morton in Tazewell County, which only had 0.58 inches of rain. In contrast, the wettest point in the state in September was Warsaw in Hancock County, with 7.51 inches. One silver lining of the dry weather in the latter half of September was that it allowed a smooth start to fall harvest. However, deteriorating conditions in southern and central Illinois have resulted in an increased fire risk and concerns of low levels in the Mississippi and Illinois Rivers.
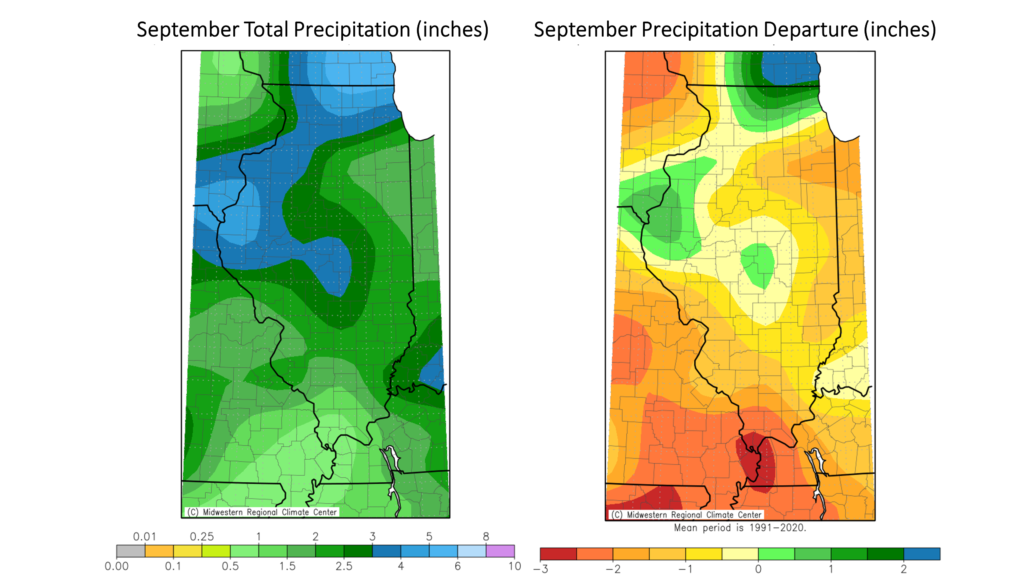
Overall, the preliminary statewide average total September precipitation was 2.66 inches, 0.53 inches below the 1991–2020 average and the 41st driest on record statewide.
The 2021-2022 Water Year
The transition from summer to fall is typically our hydrologically driest time of the year as a result of higher evaporative demand and human demand for water in summer. In contrast, the transition from winter to spring is typically our hydrologically wettest time of the year. Therefore, to best capture the seasonal variability of water availability and water balance, we denote a “water year,” which runs from October 1 to September 30. Figure 4 shows total precipitation and precipitation as a percent of normal for the 2021-2022 water year (October 1, 2021–September 30, 2022). Total water year precipitation ranged from nearly 60 inches in southern Illinois to less than 30 inches in far western Illinois. In all, water year precipitation was between 75 and 125 percent of normal statewide.

Outlooks
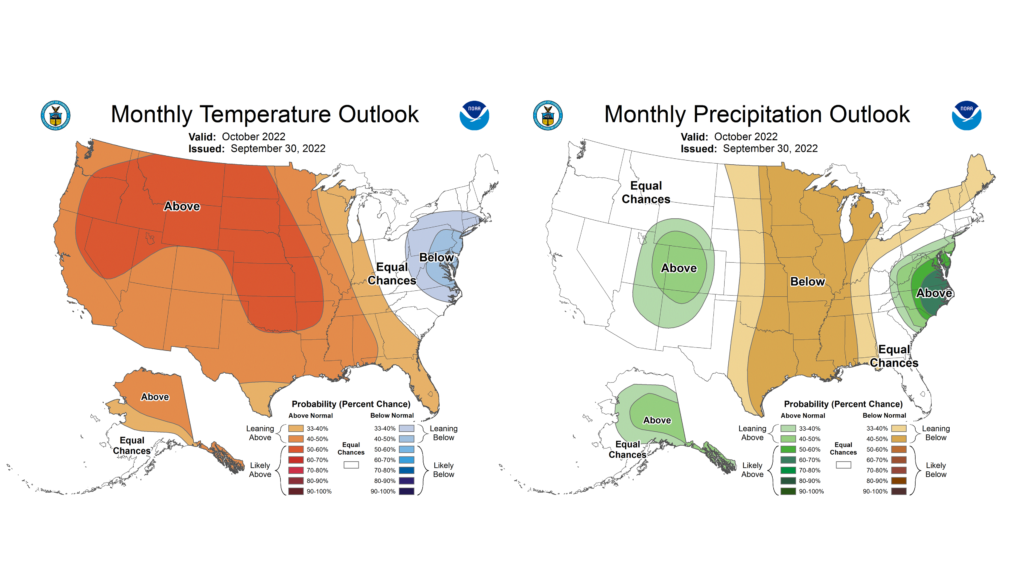
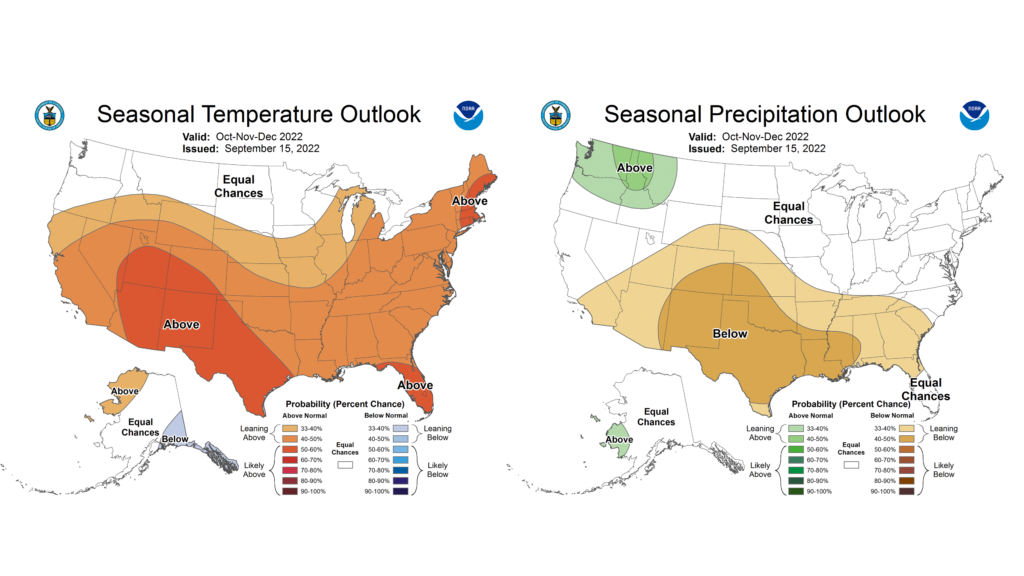
Climate Prediction Center outlooks for October lean toward warmer and drier than normal conditions statewide (Figure 5). Similarly, outlooks for the last three months of the year also lean toward warmer than normal conditions, with near normal rainfall (Figure 6).
