Illinois First Fall Freeze Climatology

Due to significant planting delays across most of the Midwest this year, I have heard many concerns about an early fall freeze and its potential effects on immature crops. Most plants experience damage from a hard freeze or “killing freeze”, which is typically designated by a daily minimum air temperature at or below 28°F. Even in normal growing seasons, an early fall freeze can cause considerable impacts and yield losses for crops. Delayed planting, as was the case this season, increases the risk of freeze damage because crops are less mature going into our normal fall freeze time.

The maps and summary below show first fall freeze dates across Illinois using temperature observations over the period 1979 to 2018. The maps show the earliest and latest fall freeze dates over this 40-year period, as well as the median date, which represents the middle value in the range of dates. The median is preferred over the mean or average, as it is less sensitive to very early or very late freeze dates. Also shown are the 10th (1 in 10 years) and 90th (9 in 10 years) fall freeze dates. All station temperature data were provided by the Midwest Regional Climate Center (https://mrcc.illinois.edu); the shaded areas between stations on the map were interpolated and do not represent actual observations.
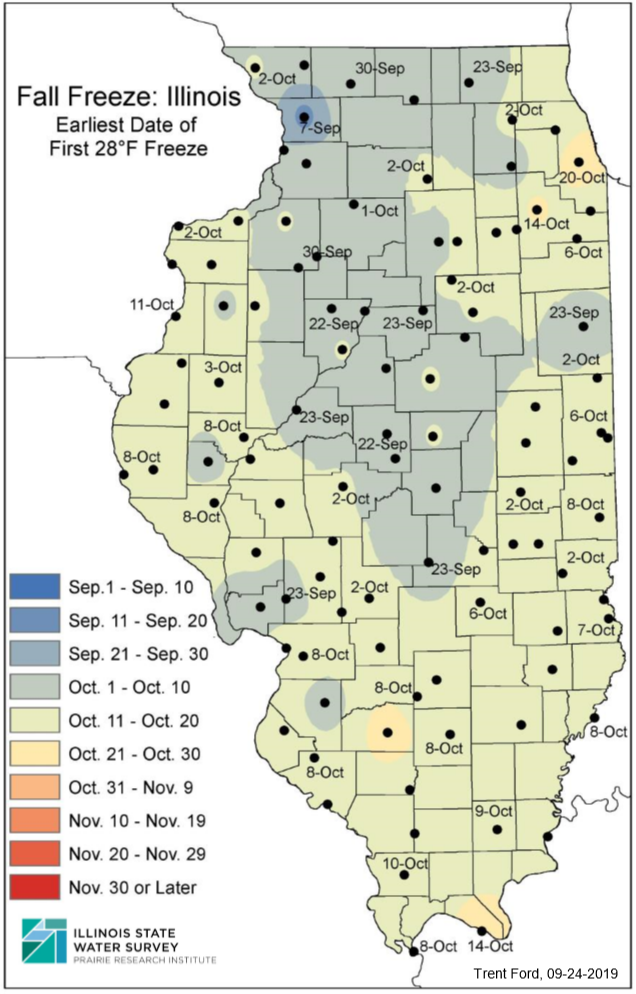
The earliest fall freeze dates over the past 40 years range from late September in northwest and central Illinois, to early October in southern and eastern Illinois. An early freeze anomaly can be seen at the Mt. Carroll station (Carroll County), which experienced a minimum temperature of 27°F on September 7, 1988. Interestingly, the observed all-season Illinois minimum temperature record was broken earlier this year at the Mt. Carroll station (-38°F).
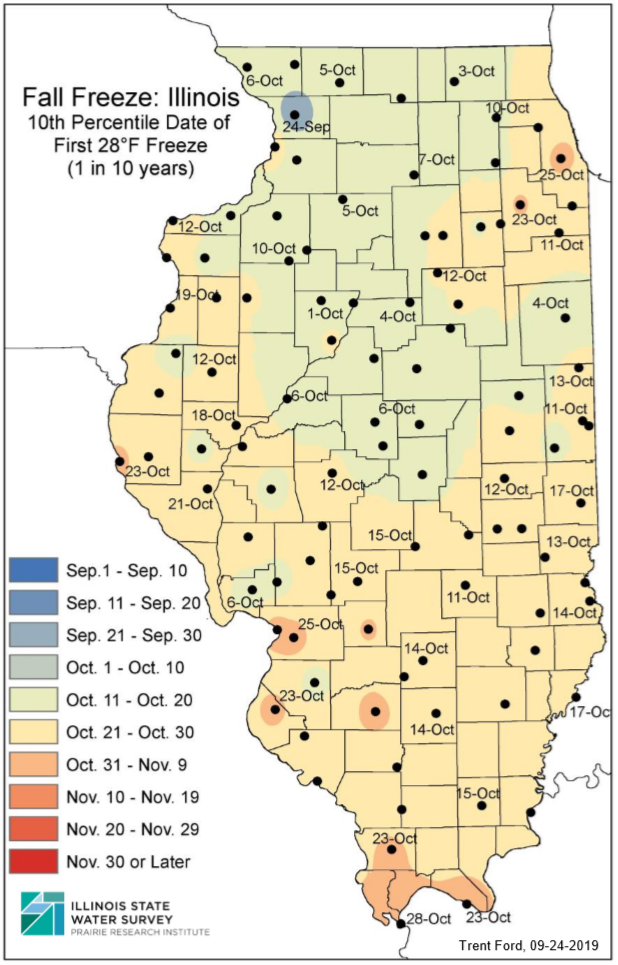
Tenth percentile first fall freeze dates (i.e., 1 in 10 years) range from early October in northwest and central Illinois to mid- to late October in southern and eastern Illinois.
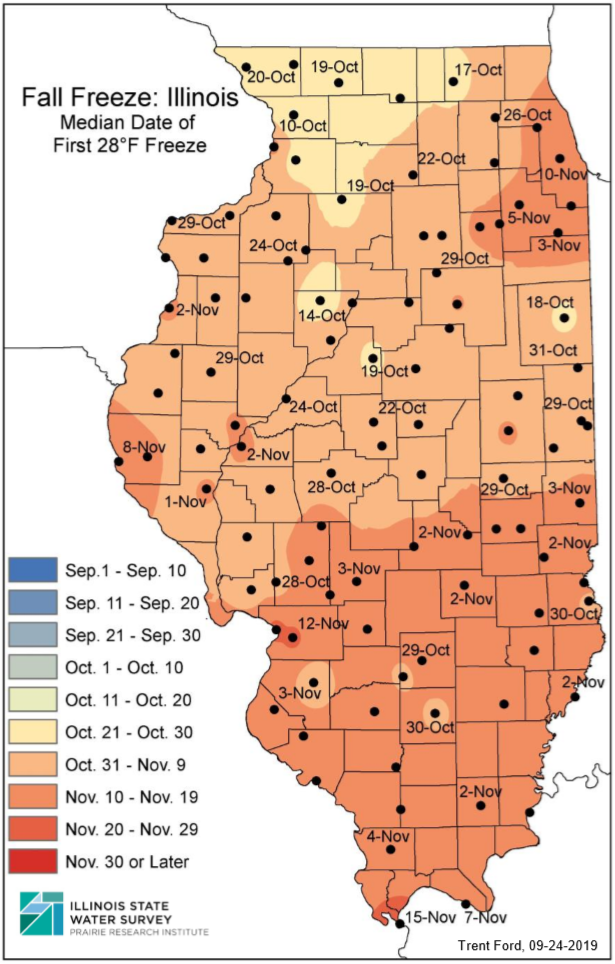
Median first fall freeze dates range from mid- to late October in northwest and central Illinois to late October/early November in southern and northeastern Illinois. Approximately half the years between 1979 and 2018 experienced the first fall freeze before the median dates. Also, the median dates map clearly shows the effects of the developed Chicagoland area on nighttime minimum temperatures. The median first fall freeze date at Chicago Midway is 10 to 15 days later than in some of the collar counties.
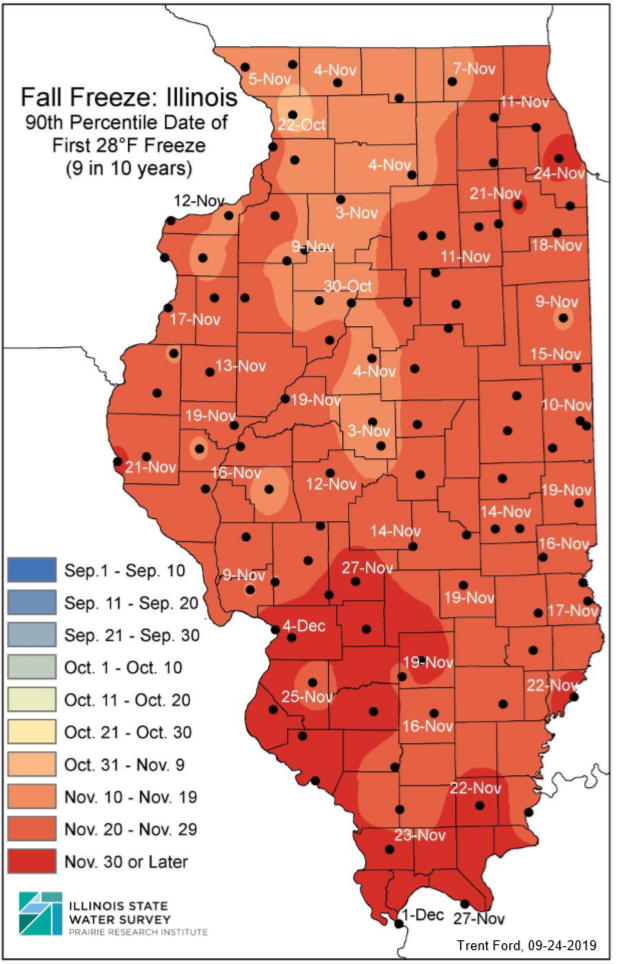
Ninetieth percentile first fall freeze dates (i.e., 9 in 10 years) range from early November in northwest and central Illinois to mid- to late November in southern Illinois. Based on the 40-year climatology, one could say that there is a 90% chance that the first fall freeze on any given year will occur on or before the dates in the 90th percentile map.
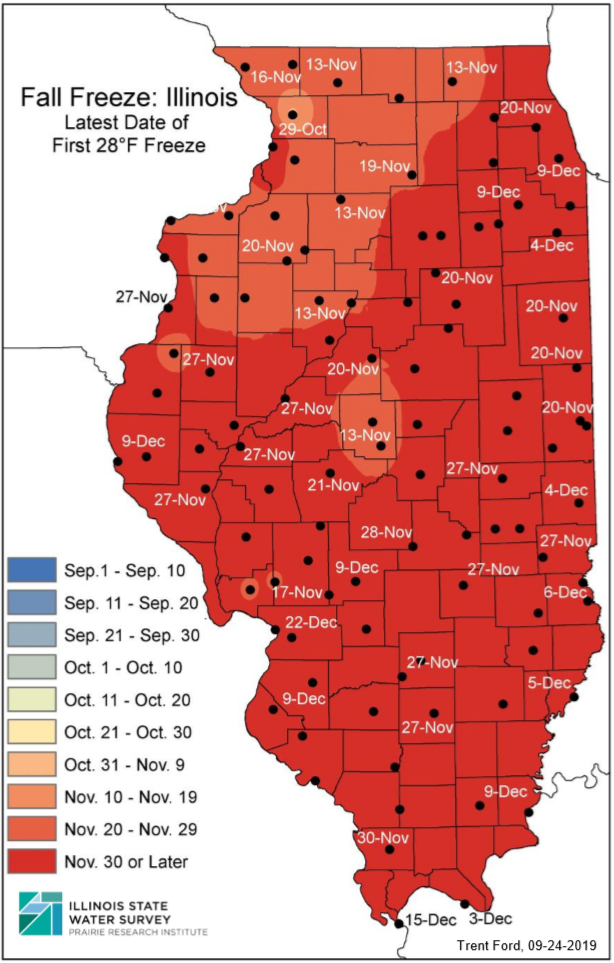
Finally, the latest first fall freeze dates across the state range from mid- to late November in northwest Illinois to early to mid-December in southern Illinois.

Note that air temperatures can vary considerably on smaller or micro-scales. For example, plants near heated buildings or other development can be spared when minimum temperatures dip below the 28°F threshold in the countryside. More information and useful freeze products are provided by the Midwestern Regional Climate Center as part of their Vegetation Impact Program (https://mrcc.illinois.edu/VIP/indexFFG.html).  Higher quality, full-page maps can be accessed by clicking the following links:

10th_Percentile 90th_Percentile Earliest Latest Median

September in Illinois: Cooler and Wetter Than Normal

September

The statewide average temperature for September in Illinois was 64.6 degrees, 1.6 cooler-than-normal. This was the first cooler-than-normal month of 2012, and the first cooler-than-normal month since September of 2011. See graph below.
The statewide average precipitation for September was 4.9 inches, 1.7 inches wetter-than-normal. This is the first wetter-than-normal month in 2012. See second graph below.
Much of the September rainfall came from the remains of Hurricane Isaac that passed over Illinois on Labor Day weekend. Additional rains fell later, especially in south-central Illinois. In general, areas south of Interstate 80 had monthly totals in the 3 to 12 inch range. A few sites in that region reported over a foot of rain with the largest total at Centralia with 15.89 inches. See first map below.
Precipitation totals north of Interstate 80 were around 1-2 inches. One of the driest spots in the state was Elburn (Kane County IL-KN-30) with only 1.28 inches for the month. Chicago and Rockford were not far behind with O’Hare Airport reporting 1.76 inches while the Rockford airport reported only 1.74 inches for September.
By the end of September, drought conditions had eased somewhat according to the US Drought Monitor.  Only 6.7 percent of the state was in the worst two categories  of drought (D3 and D4). This compares to 70 percent of the state in the two worst categories at the end of August. Even so, 82 percent of the state still remained in some stage of drought at the end of September.

January-September

Even with a wet September, the January-September statewide precipitation total of 22.38 inches was 8.34 inches below normal and the fifth driest on record. Here are the top five:

  1. 1988 with 19.49″
  2. 1901 with 19.84″
  3. 1936 with 21.76″
  4. 1940 with 22.17″
  5. 2012 with 22.38″

Remarkably, the precipitation over the last two months has erased the precipitation deficit since January 1 in much of Fayette, Washington, Clinton, Bond, and Montgomery counties. Sizable deficits remain across much of Illinois, especially western and northern Illinois as well as far southern Illinois. See second map below.
The January-September statewide average temperature of 59.6 degrees was 4.1 degrees above normal. It was the second warmest January-September on record and just slightly cooler than the record of 59.7 degrees set in 1921.
Notes: “normal” refers to the 1981-2010 averages. Statewide temperature and precipitation records began in 1895.

Statewide temperature departures from normal for September in Illinois. Click to enlarge.

Statewide precipitation departure from normal for September in Illinois. Click to enlarge.

30-day precipitation total through the morning of September 29 for Illinois. The 30-day map for September 30 failed to run. Click to enlarge.

Year to date precipitation departures from normal through September 29 for Illinois. Click to enlarge.

Sunny and Dry Start to October

The first 10 days of October have been warm, dry, and sunny in Illinois.  The statewide average temperature is 61.3 degrees, 3.8 degrees above average.
The statewide average precipitation is zero. Only a handful of sites in far western Illinois have reported anything. The highest total so far in the state was 0.44 inches from a CoCoRaHS site near Carthage, Illinois.
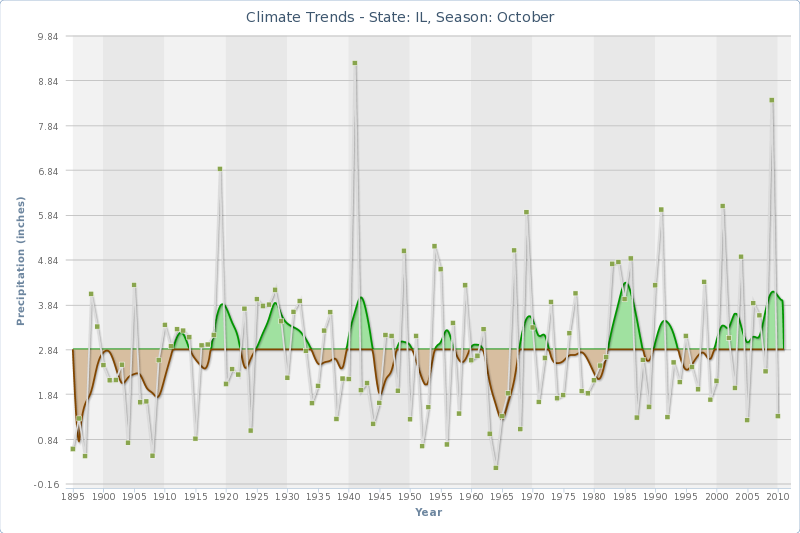
The driest October on record in Illinois was 1964 with only 0.20 inches for the entire month. Last year (2010) was the 19th driest October with only 1.35 inches. However, October 2009 was second wettest with 8.40 inches.
Here is a look at how October precipitation has behaved since 1895 in Illinois. The green dots are the individual years. The alternating brown and green shaded area show below and above average precipitation, respectively. The average is based on the period of record (1895-2010). You can see a lot of year to year variability in the numbers and no clear long-term trends.

October precipitation in Illinois from 1895 to 2010. Click to enlarge.

September in Illinois – Cool

Based on preliminary numbers, the statewide average temperature for September in Illinois was 63.2 degrees, 3 degrees below average. That makes it the 13th coolest September on record for Illinois. The coolest September was 1918 with 59.3 degrees. Statewide records go back to 1895.
Despite the overall cool readings for the month, Labor Day weekend was very hot. Highs in the upper 90s and low 100s were common during that time. One of the hottest was Quincy with 104 on September 1. In all, at least 65 stations in Illinois either tied or broke daily records for high temperatures in early September (text file with details).
On the other extreme, the coldest spot for the month was Paw Paw with 32 degrees on September 15. Twenty-two stations either set or broke daily records for low temperatures (see text file for details).
The statewide average precipitation for September was 3.53 inches, 0.34 inches above average. Rainfall was stubbornly sparse in the areas hardest hit by drought where only 1-2 inches were common. Amounts in far southern and northern Illinois were much wetter at 4-8 inches.
The highest rainfall total for the month was by a CoCoRaHS observer in Bush, Illinois, with 8.42 inches. In second place was a CoCoRaHS observer in Harrisburg, Illinois, with 8.04 inches. The reported driest spot in the state was a CoCoRaHS observer in Warsaw with only 0.69 inches of rain for the month. CoCoRaHS observers are volunteers that use standard equipment and training. Therefore, their results are comparable to other networks.

September rainfall
September 2011 rainfall for Illinois. Click to enlarge.