May 2019: Exceptionally Wet and Stormy Across Illinois

May 2019 will be a month remembered for exceptional, record-breaking wet conditions locally, as well as an active, stormy, and at times severe weather pattern across the state.

Preliminary data suggest that May 2019 finished significantly wetter than average, with temperatures marginally below the long-term average. The preliminary average statewide May temperature was 62.5°F, which is 0.2°F below the long-term average. The preliminary average statewide precipitation was 8.43 inches, which is 3.83 inches above the long-term average.

Precipitation

Preliminary statewide average precipitation for May was 8.43 inches, which is 3.83 inches above the long-term average, marking six consecutive months with above average statewide precipitation. As it stands now, spring 2019 will rank within the top four wettest spring seasons in state history (March–May), with May 2019 ranking as the third wettest May in state history.

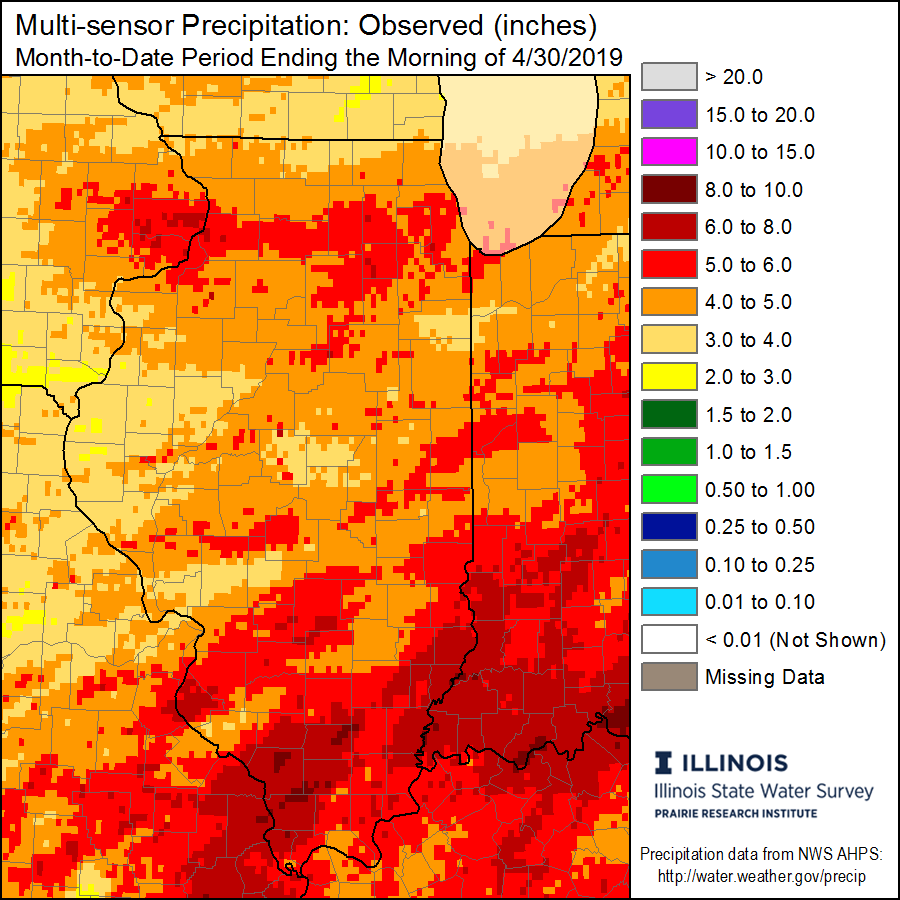
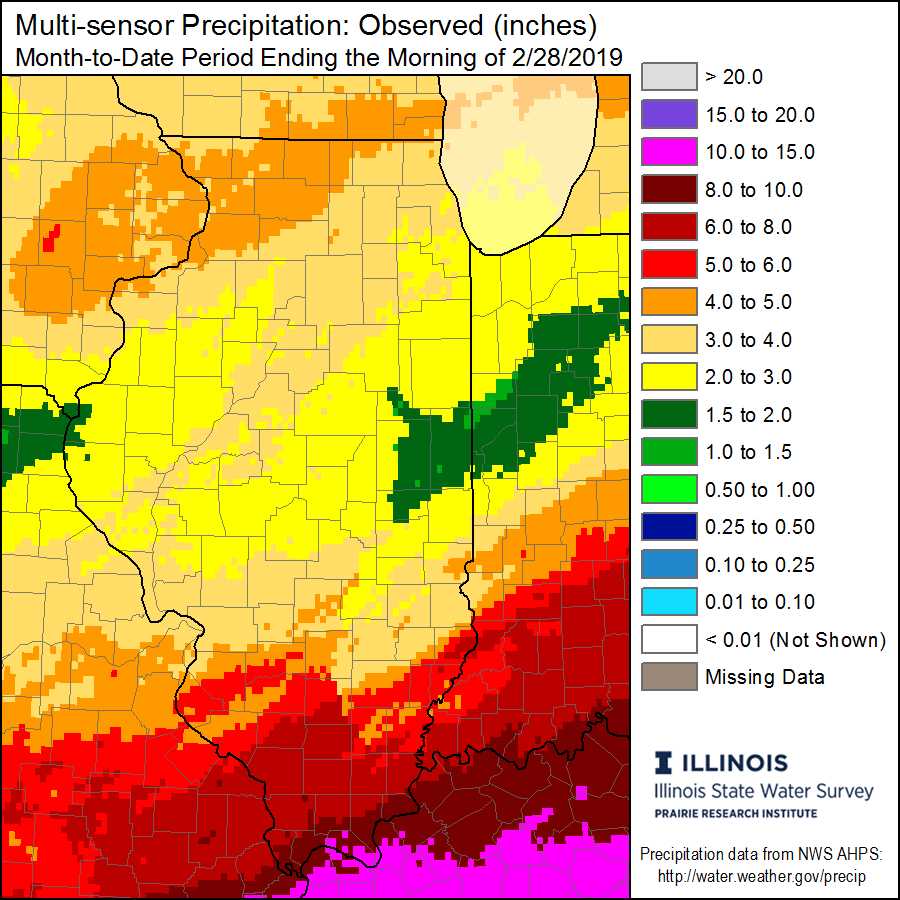
The multi-sensor precipitation departure map for Illinois shows that practically the entire state received above average precipitation for the month. The only exception was a small region in east-central Illinois near Edgar County, where near to slightly below average precipitation occurred (see maps below).

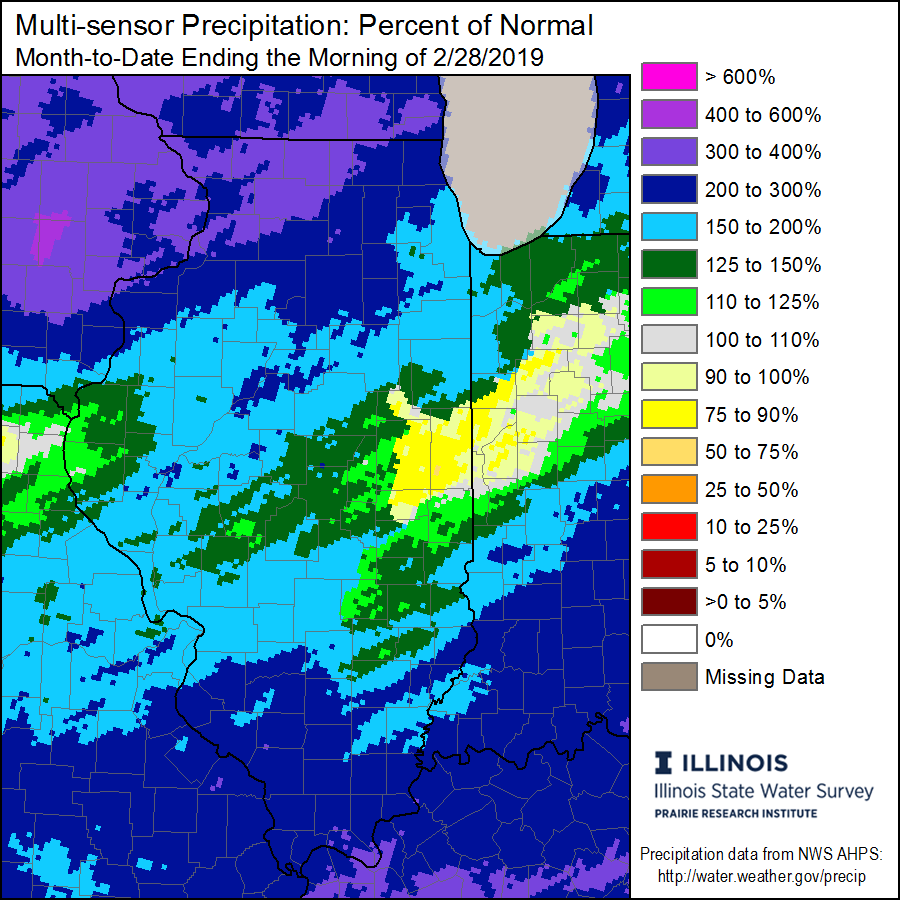
Portions of west-central and northern Illinois reported the heaviest rainfall for the month, where monthly precipitation departures of 5 to 8 inches above average were common, bringing 200 to 300 percent of average monthly rainfall.  An area roughly defined between Quincy and the Quad Cities extending eastward to near Peoria received the most precipitation in the state, with 7 rain gages in this region recording 13 or more inches of rainfall during May.

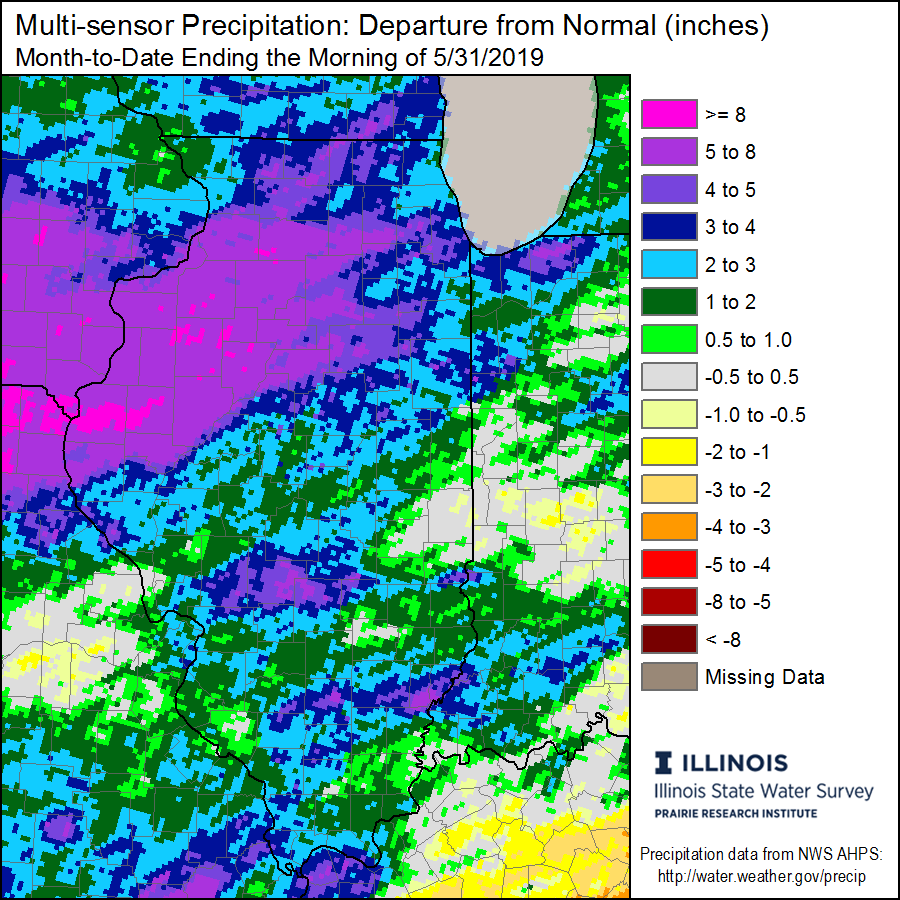
A gage near Dallas City (Hancock County) reported the highest precipitation total for May, with an impressive 14.75 inches.

Data from the National Weather Service showed that with a report of 8.25 inches, Chicago experienced its wettest May on record, beating the 8.21-inch reading that was set just last year in May 2018.

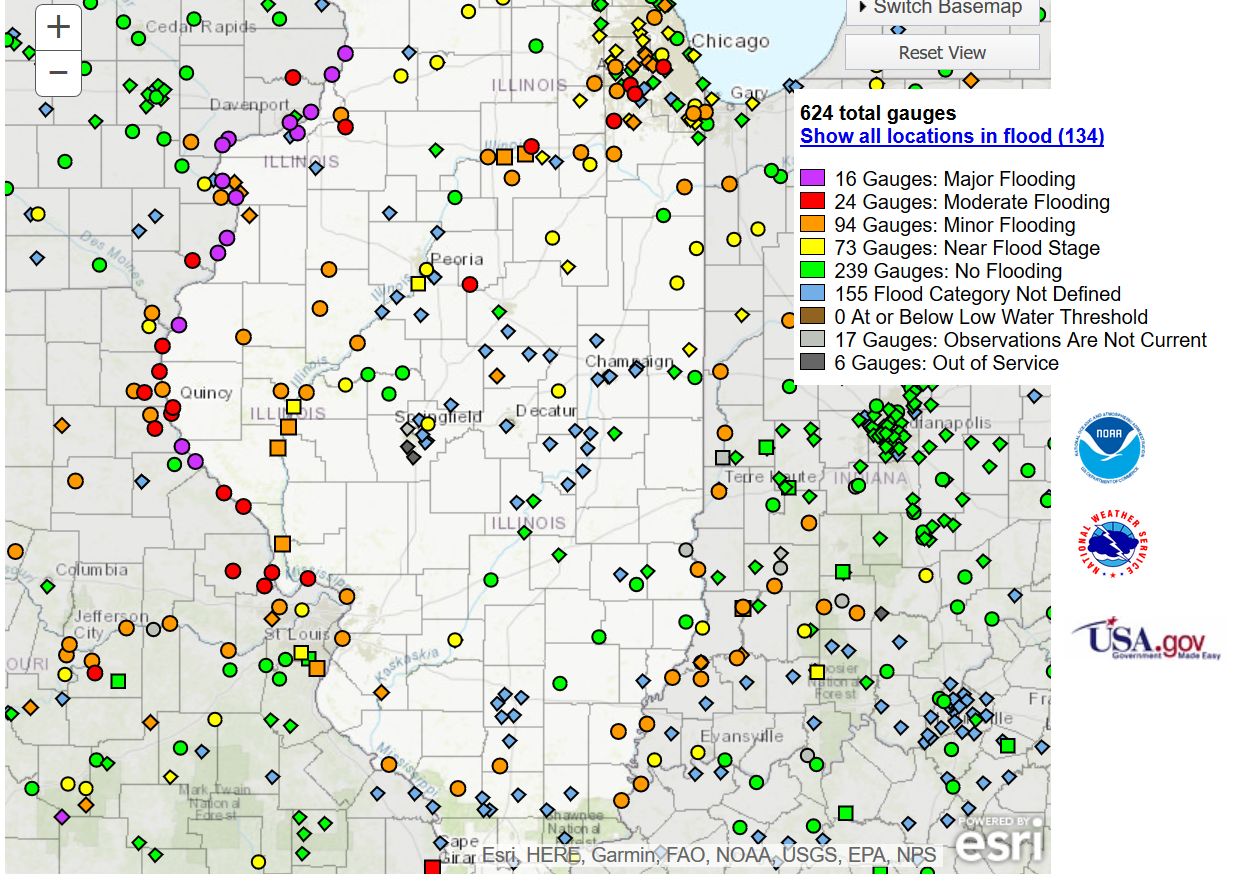
The abnormally wet May weather has led to a continuation of elevated flooding risks and significant planting delays for the Illinois agricultural community.  Moderate and major flooding along many local streams and rivers is still ongoing, with flood warnings along both the Illinois and Mississippi Rivers in effect until further notice.

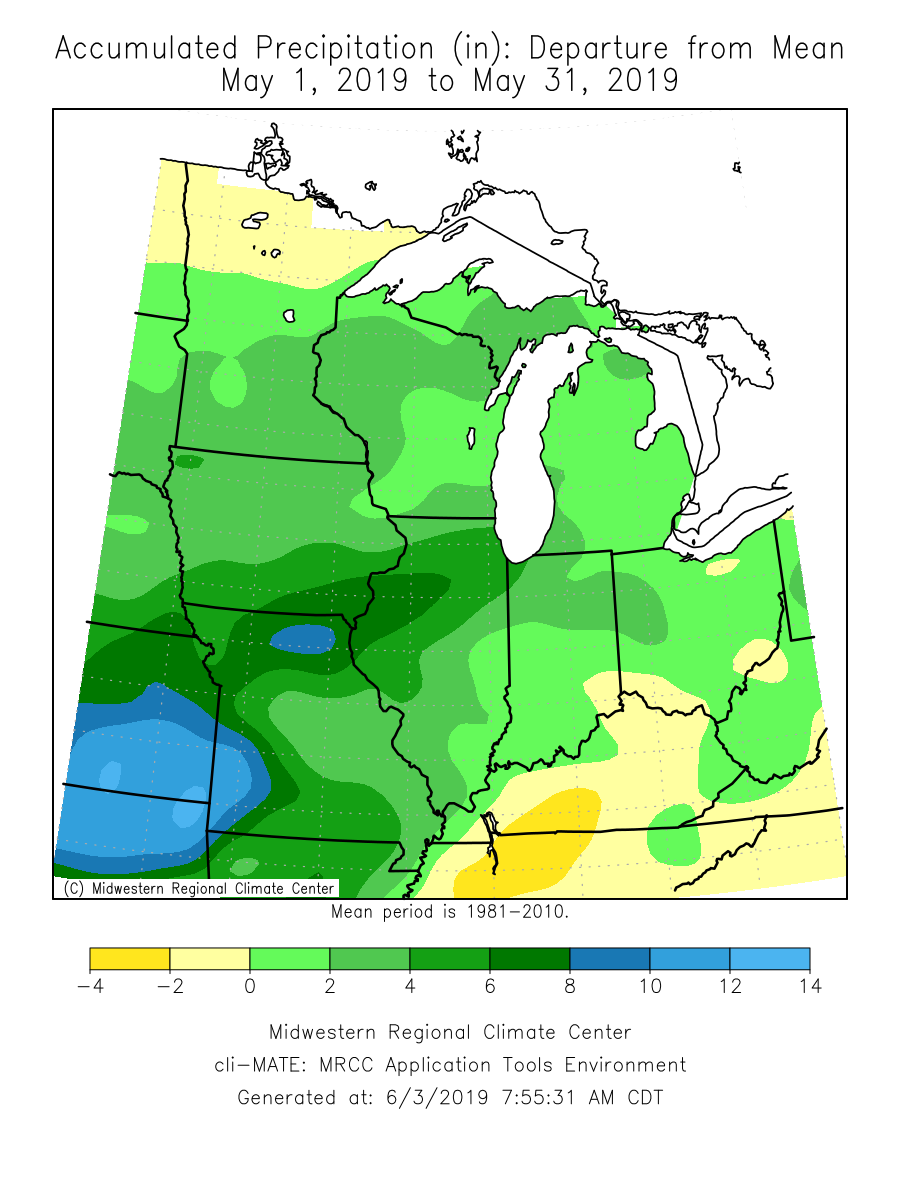
Wet, active, and stormy weather has not only been an issue for Illinois, but also the weather has been a growing risk across much of the central and southern Midwest including the Corn Belt where notable above average precipitation departures for May were also present (see map below).

Severe Weather

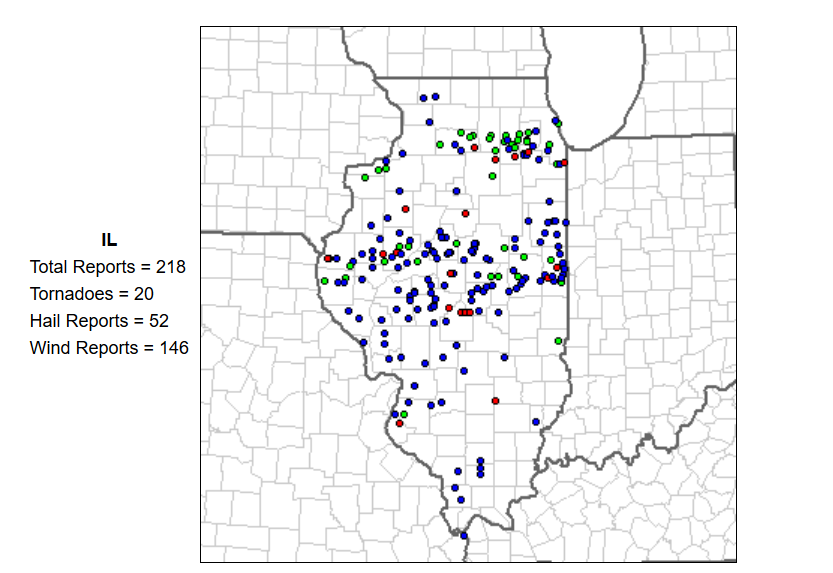
In addition to the relentless rainfall, multiple rounds of severe weather impacted the state throughout the month. Statewide, 218 severe weather reports were noted from the Storm Prediction Center, 20 for tornadoes (red), 52 for hail (green), and 146 for wind (blue). Note that multiple reports may be generated for a single event.

Map of May 2019 Severe Weather Reports in Illinois, updated 6/4/2019

Temperature

Preliminary results show that May 2019 finished with a statewide average temperature of 62.5°F, which is 0.2°F below the long-term average.

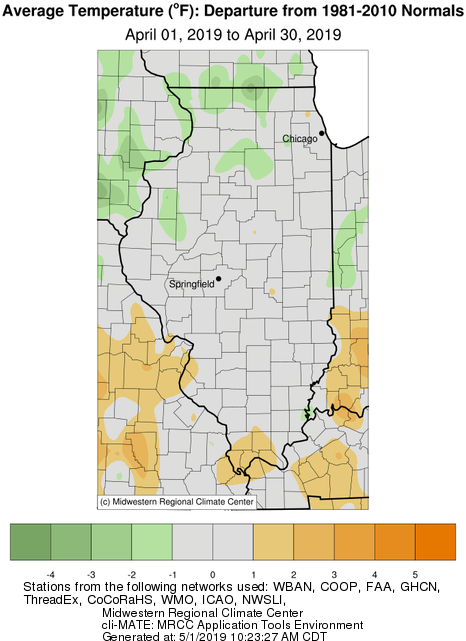
Monthly temperature departures showed that the northern third of the state generally saw average temperatures of 1 to 3 degrees below normal, while the southern third of the state generally saw average temperatures of 1 to 3 degrees above normal, with near normal temperatures occurring throughout central Illinois.

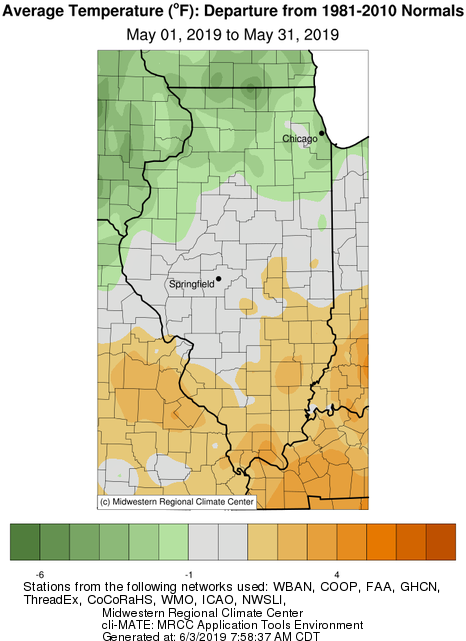
The highest maximum temperature in the state was recorded at the Kaskaskia River Navigation Lock (Randolph County) with a reading of 93°F on May 26. In contrast, the lowest minimum temperature of 31°F was recorded at the Chicago Botanical Garden (Cook County) on May 4.
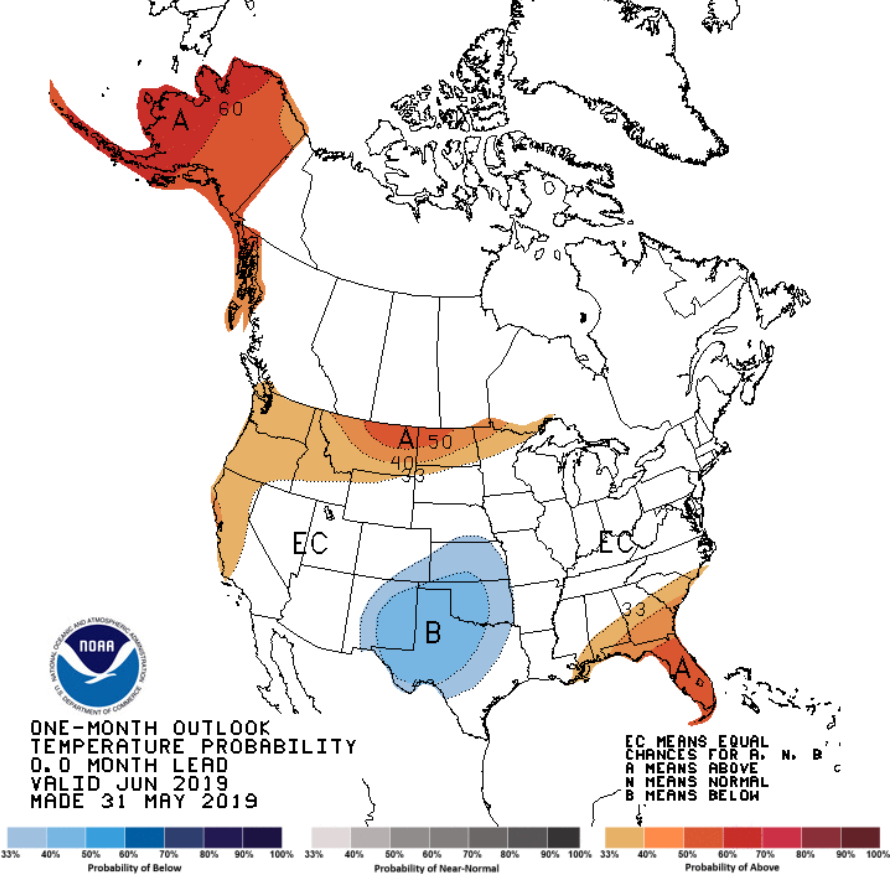
June 2019

Although an active weather pattern looks to continue at least for a portion of the first full week of June, the monthly outlook from the Climate Prediction Center favors equal probabilities for below, near, or above average precipitation and temperatures across Illinois for June 2019.

April 2019: An Active Weather Pattern and Late Season Snow!

April 2019 will be a month remembered for a continuation of an active and stormy weather pattern across Illinois, with two short lived, yet notable and uncommon late season snow events which impacted many in northern portions of the state.

The month finished noticeably wetter than average, with temperatures marginally below the long-term average. The preliminary average statewide April temperature was 52.0°F, which is 0.6°F below the long term average. The preliminary average statewide precipitation was 4.58 inches, which is 0.80 inches above the long term average.

Note: Data are provisional and may change slightly over time.

Precipitation

Preliminary statewide average precipitation for April was 4.58 inches, which is 0.80 inches above the long term average.

Precipitation in Illinois has been above average since December 2018. Preliminary data would rank this as the 7th wettest December – April period in state history. The end of April 2019 marked six months since any portion of the state has been classified as in drought, or abnormally dry by the U.S Drought Monitor..

An active spring weather pattern resulted in a majority of regions in northern, eastern, and southern portions of the state receiving over 100% of average monthly precipitation, with localized amounts approaching 200%.  Smaller regions of the state in west-central Illinois – roughly between the Mississippi and Illinois rivers are the only locations to receive near or below average precipitation for the month (see map below).

The heaviest precipitation fell in extreme southern Illinois, especially in counties bordering the Wabash and Mississippi Rivers, where 6 to 8+ inches were common (see map below).  The highest total in the state was reported at a station near Cobden (Union County) with 8.31 inches.

Heading into May, flooding remains an ongoing concern for the state, as soil moisture percentiles remain in the 90th to 95th percent range.

As of April 30th, 134 river gauges affecting Illinois were reported with crests in minor, moderate, or major flood stages. The greatest threat continues to remain along the Mississippi River. River flooding concerns were intensified by several days or heavy rains during the last week of April.

Snowfall

A majority of April snowfall came from two short lived, yet notable late season events that impacted many in northern portions of the state.

The first event on the weekend of April 13th and 14th brought widespread reports of 1 to 5 inches along a corridor extending from near Quincy, and running northeast toward Chicago and the Illinois/Wisconsin border. Several localities west and north of Chicago reported 6 to 8+ inches. Notable accumulations were measured as far south as Peoria. An accumulation of 5.4 inches at Chicago O’Hare Airport tied the record for the snowiest calendar day this late in the season.  April 16, 1961 also recorded 5.4 inches of snow.

The second snow event on April 27th brought a variety of wintry precipitation types to locations in northern Illinois, including another round of accumulating snow for many from Chicago and points north and west.  With 3.7 inches, this was the latest 2+ inch snow event on record for Rockford (Winnebago County).

The maximum monthly snowfall in Illinois was reported at a station near St. Charles (Kane County) with an impressive 13.5 inches.

Temperature

Preliminary results show that April 2019 finished with a statewide average temperature of 52.0°F which is 0.6°F below the long term average.

Despite several significant temperature swings throughout the month, which are common during springtime, statewide April temperatures finished right around the long term average. A few pockets in extreme southern Illinois reported slightly above average, and sporadic regions in northern Illinois reported slightly below the long term average.  This is a welcome change from last year,  April 2018, which ranked as the second coldest April on record.

The highest temperature in the state was recorded at a station near Jerseyville (Jersey County) with a reading of 85°F on April 23.  In contrast, the lowest temperature of 18°F was recorded at a station in Altona (Knox County) on April 1.

May 2019

Looking ahead at the rest of May 2019, the Climate Prediction Center (CPC) is favoring probabilities of above average temperatures for the southeast half of the state, with equal chances of above, near, or below average temperatures for the northwest half of the state. Unfortunately, an active weather pattern looks to persist, as the May outlook favors probabilities of above average precipitation statewide.

Meteorological Winter Recap: 2018-2019

Winter Review:  December – February (2018-2019)

Although the first week of March 2019 does not give us the satisfaction that spring will be arriving in the near future, it does mark the end of the meteorological winter season, which runs from December – February.

Despite what felt like an eternity of below average temperatures, the season as a whole finished with temperatures relatively close to the long term average. Referring to the map below, which represents average temperature departures, a few localities in the west-central and northwest portions of the state saw temperature departures of 1°F or more below average.  On the opposite end, locations in southern Illinois experienced temperature departures of 1-2°F above average during the 2018-19 winter season.

Statewide temperatures averaged 29.9°F, 0.8° above the long term average.

Average temperature for the season ranged from the low 20s north, to around 40° toward extreme southern Illinois.  Large variations occurred with seasonal highs in the 70s and lows in the -30s. The maximum temperature of 71°F occurred on Dec. 1 at Kaskaskia Navigation Lock in Randolph County.  The lowest temperature of -38°F occurred on Jan. 31 at Mt. Carroll in Carroll County, setting a new state record minimum temperature.

The last two days of January brought widespread cold weather to Illinois.  Many locations experienced some of the coldest weather that has been seen in decades allowing numerous daily and station record lows to be broken.  This event produced statewide temperature departures of 20 to 30° below average.

To gain additional perspective on this event, the updated map below displays the minimum temperature recording at stations throughout Illinois with at least 20 years of data.  The color of the station plot represents the month of occurrence, and temperatures in bold represent new records that were set in 2019 (click the map for a larger PDF version).

Precipitation was abundant throughout the state this winter season (see map below), this allowed the entire state to remain free of any abnormally dry, or drought designations during this period. Above average precipitation occurred every month during the season. Generally precipitation totals across Illinois ranged from 5 to nearly 15 inches, with counties south of I-70 experiencing the most precipitation.

Most remarkable was the 21.18 inches of precipitation reported at Smithland Lock and Dam on the lower Ohio River.  Overall, both southern and northwest Illinois received over 150% of their average winter precipitation, with several localities approaching 200% (see map below).

Statewide seasonal precipitation averaged 9.67 inches, which is 2.85 inches above the long-term average, ranking as the 6th wettest winter season on record for the state (with records going back to 1895-96).

The total accumulated snowfall map shows that snowfall occurred statewide this winter, with the heaviest accumulations centered in northwestern Illinois, and counties along the Illinois/Wisconsin border. Totals ranged from 1 to 10 inches in southern Illinois, 10 to 20 inches in central Illinois, and 20 to over 40 inches in northern Illinois.


Stormy, wet, and chilly February for Illinois

February 2019 will be a month remembered for an unseasonably active storm pattern, a majority of the month was characterized by a seemingly constant succession of storms resulting in moderate snow accumulations for the northern counties, and persistent rain events and widespread flooding for the far southern counties.  Between storm systems we experienced noticeable temperature swings, and periods of seasonable weather.

Statewide, February ended colder and substantially wetter than the long term average.  The preliminary average statewide February temperature was 28.6°F, which is 2.3°F below the long term average.  The preliminary average statewide precipitation was 3.33 inches, which is 1.27 inches above the long term average.

Data are provisional and may change slightly over time.

Temperature

Preliminary results show that February 2019 finished with a statewide average temperature of 28.6°F which is 2.3°F below the long term average.

The maximum February temperature of 70°F was reported at two stations, Dixon Springs (Pope County) on February 3rd, and Kaskaskia River Lock (Randolph County) on February 4th.  These temperatures came less than a week after the historic Arctic outbreak in late January, which shattered numerous all time station and daily record lows across Illinois.  Over the course of five days many stations across the state saw temperature differences of around 70 degrees or more from Jan. 31 to Feb. 4.

The minimum state temperature was -36°F reported at the Mt. Carroll observation station (Carroll County) on February 1st, a day after the station recorded a potential record state minimum temperature of -38°F on last day of January 2019.

The map below depicts average monthly statewide temperature departures for Illinois.  In February, the departure gradients tended to align in a southwest to northeast fashion, following the larger scale storm tracks.   Overall, Southeastern Illinois saw temperature departures averaging one to three degrees above normal, while much of Central Illinois was near the long term average, and a larger region in the vicinity of Northwest Illinois saw temperature departures averaging two to five degrees below normal.

Precipitation

Preliminary statewide average precipitation for February was 3.33 inches, which is 1.27 inches above the long term average.

Total precipitation was one of the biggest weather concerns for February.  While locations in the center of the state, roughly between I-80 and I-70, received anywhere from 1.5-4.0 inches of precipitation for February, the most impressive totals fell in far Northwestern and Southern Illinois (see map below). In Southern Illinois February totals in excess of 6.0 inches were common, with five stations reporting over 8.0 inches of precipitation for the month.

The highest monthly total was reported at Smithland Lock and Dam (Pope County) with an impressive 10.68 inches.  This ranks as the wettest February on record for the station, with records going back to 1981.

The persistent February precipitation corresponded to monthly totals of 300-400% percent of normal for Northwestern Illinois, and 200-300+% of normal for Southern Illinois (see map below).

Once final numbers are calculated, Feb. 2019 is on track to rank within the top 15 wettest statewide February’s on record.  Abundant regional February rainfall also contributed to a major flooding event in the lower Ohio River.  Both the Smithland Lock and Dam and Cairo river gauges crested at over 10 feet above flood stage during the last week in February. Maximum river stages are expected to be within the top 5 highest on record, according to data compiled by the National Weather Service.

Soil moisture percentiles for the month of February remained in the  90th percentile or higher across Illinois.

Snowfall

Snowfall occurred statewide during February, but was most plentiful in counties along the Illinois/Wisconsin border, where 10+ inches of accumulation were common (see map below)

The highest point snowfall total of 25.7 inches was reported at a station in Galena (Jo Daviess County).

Outlook for March 2019

Looking ahead at the rest of March 2019, the Climate Prediction Center is favoring moderate probabilities of colder than average temperatures statewide.  The highest probabilities are located in the northwestern portion of the state.  Slightly increased probabilities of a wetter than normal March are forecast for extreme southern Illinois, the same regions that have already experienced unseasonably wet conditions for a majority of the winter.

Check back soon for a recap of the 2018-2019 meteorological winter season.