The preliminary statewide average September temperature was 68.1 degrees, 1.3 degrees below the 1991–2020 average and tied for the 38th warmest on record going back to 1895. The preliminary statewide total September precipitation was 2.64 inches, 0.71 inches below the 1991–2020 average and the 42nd driest on record.
Data are provisional and may change slightly over time.
Fall Start and Summer Finish
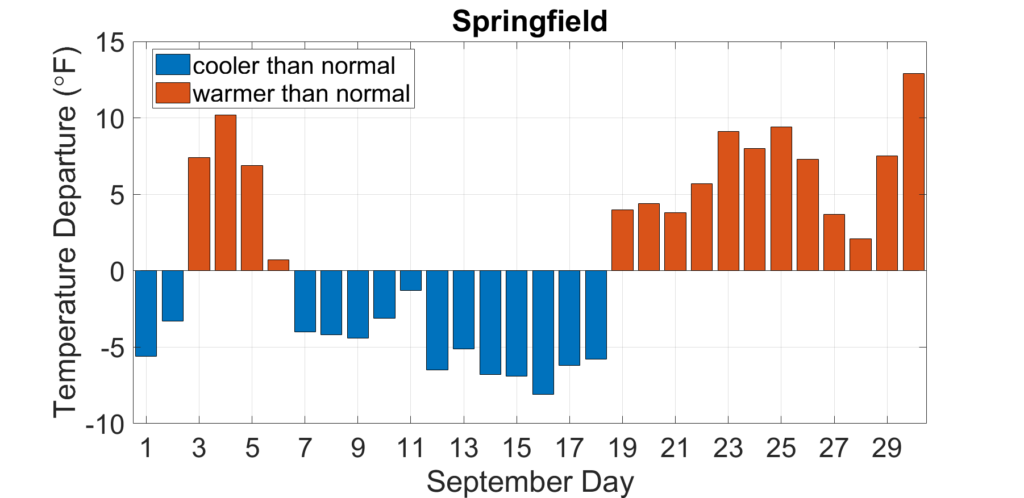
September is a transition month as we move from summer into fall. However, this year September started with fall-like weather and ended with a shot of summer. Daily average temperature departures in Springfield show most days in the first two-thirds of the month were cooler than normal, followed by several days in the last two weeks that were 5 to 10 degrees warmer than normal (Figure 1).
September average temperatures ranged from the mid-60s in northern Illinois to the low 70s in southern Illinois, between 1 and 4 degrees above normal (Figure 2). We should ignore the suspiciously low September average temperature near La Grange, Illinois because it is likely a measurement error. Several places hit highs in the low 90s in the latter half of September, including 94 degrees in Charleston and Aurora. Meanwhile, cooler weather in the first part of the month pushed some nighttime low temperatures into the 30s, including 37 degrees in Joliet and 39 degrees in Stockton.
The warm end to the month broke 10 daily high maximum temperature records and 10 daily high minimum temperature records. Additionally, 3 daily low maximum temperature records were broken last month.
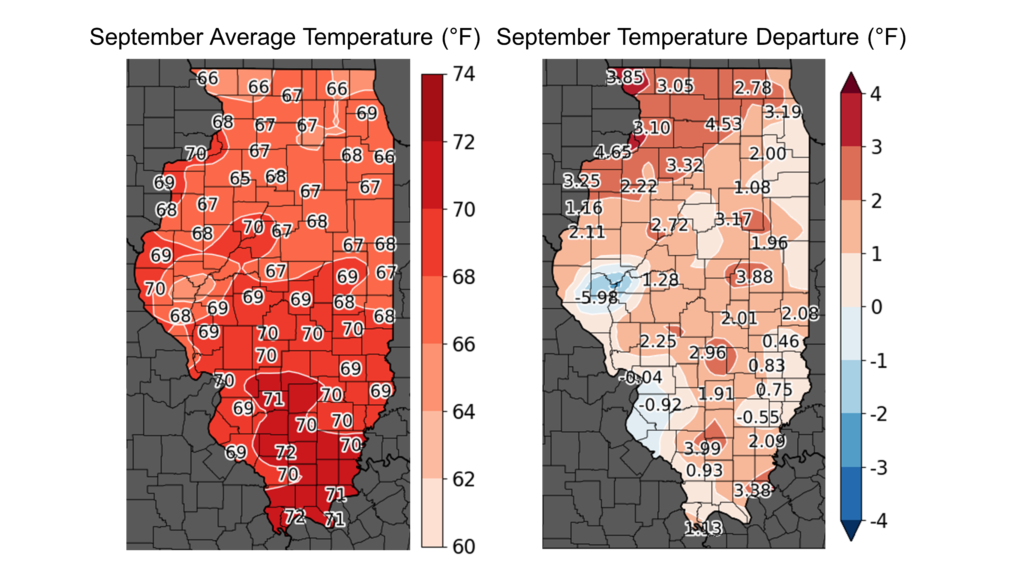
Overall, the preliminary statewide average September temperature was 68.1 degrees, 1.3 degrees below the 1991–2020 average and tied for 38th warmest on record going back to 1895.
Dry Weather Kicks Off Harvest
Another interesting aspect of September is that rain in the first half of the month is generally welcomed by the agriculture community to help finish out beans and late-planted corn. However, rain after mid-September usually disrupts, if not delays, early harvest activity. September this year worked in the opposite way, with drier conditions early and a bit more rain later in the month.
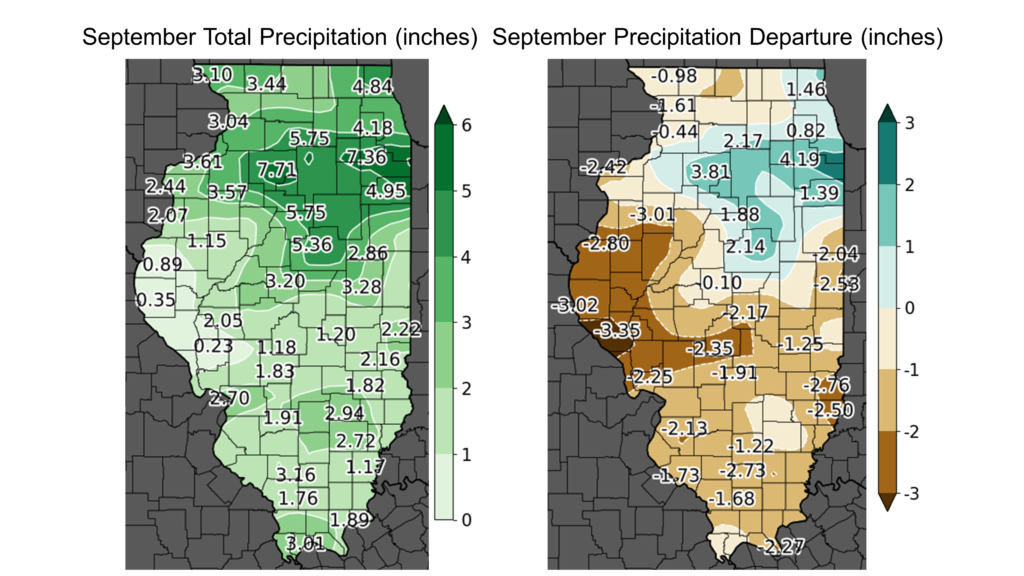
September precipitation ranged from less than half an inch in western Illinois to over 7 inches in northeast Illinois. The northeast quarter of the state was 1 to 4 inches wetter than normal in September, while much of the rest of the state was 1 to 3 inches drier than normal (Figure 3). Last month was the eighth wettest September on record in Joliet, with 6.76 inches. Last month was the fourth driest September on record in Quincy with just 0.35 inches.
Broader Midwest Drought
Drought is often considered an isolated event. A drought comes, it creates impacts, and it leaves. However, drought does not always go away with a wetter stretch of weather. In cases where multiple waves of drought are broken up by wetter periods, drought impacts can slowly accumulate. This phenomenon has been occurring in western Illinois, particularly around the Quincy area. That part of the state has moved in and out of moderate to extreme drought multiple times in the past 18 months, culminating in significant drought impacts. The 2022-23 water year, spanning October 1, 2022 to September 30, 2023 was the 3rd driest on record in Quincy, nearly 15 inches below the 30-year normal. Figure 4 shows the intense dryness over the past 12-18 months spans much of the Midwest from Kansas to central Indiana.
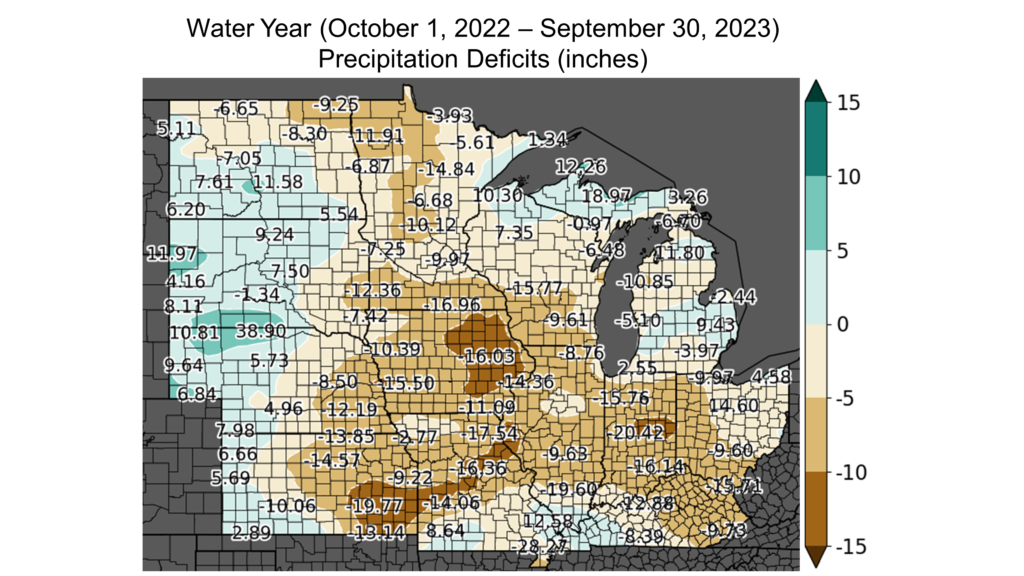
The Mississippi River has responded to the months-long Midwest drought with significantly reduced flow and near record low levels. Precipitation deficits over 12- to 18-month periods cannot be made up in a month or two, but instead require extended wetter weather over multiple seasons. Therefore, while a wet winter would be beneficial to improving soil, stream, and groundwater conditions, it is likely we’ll be coming into spring 2024 with some moisture deficits in parts of the Midwest.
Outlooks
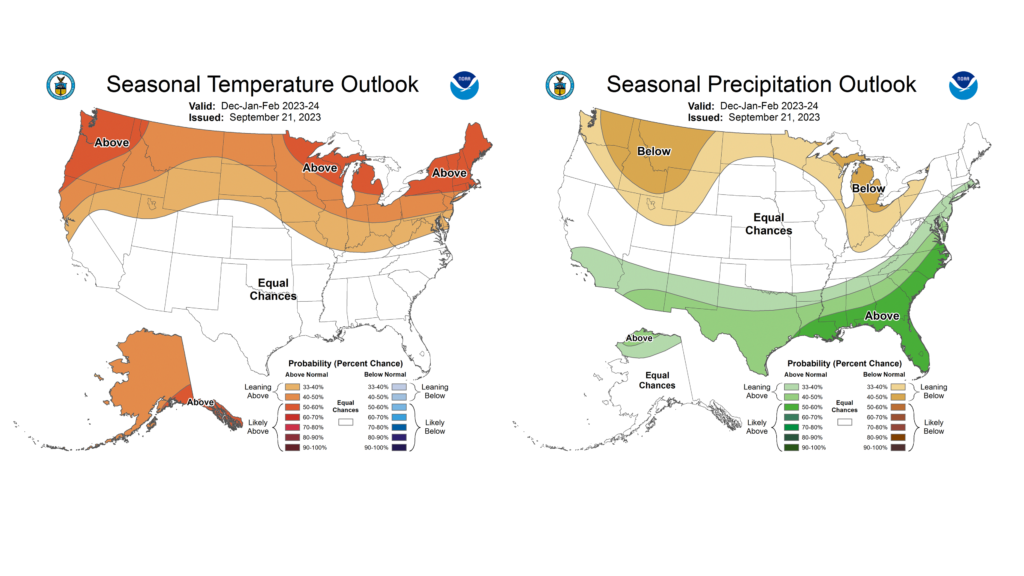
October–in my humble opinion–is the best weather month of the year. Days become noticeably shorter, nights become cooler, and hoodies and shorts become the ultimate nightwear. The Climate Prediction Center shows higher odds of a warmer and drier than normal October (Figure 5), but no doubt there will be some beautiful fall weather.
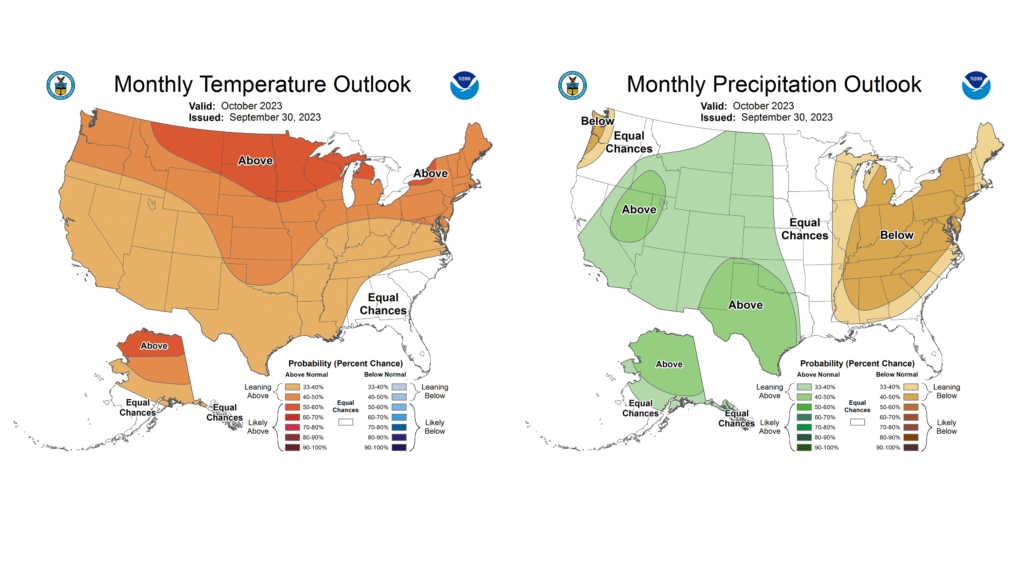
Meanwhile, October also brings in the first look at NOAA’s official winter prediction. This year, NOAA is leaning hard into El Niño with elevated chances of a warmer than normal winter season across Illinois, and slightly higher odds of drier than normal conditions in the eastern Midwest (Figure 6). It’s important to note that El Niño is an important component of seasonal climate variability in the Midwest but is only one of many important components to a winter season.
