The preliminary statewide average February temperature was 35.1 degrees, 4.0 degrees above the 1991–2020 average and tied for the 18th warmest on record going back to 1895. The preliminary statewide average total February precipitation was 3.03 inches, 0.92 inches above the 1991–2020 average and the 17th wettest on record statewide.
Data are provisional and may change slightly over time.
Persistently Mild February
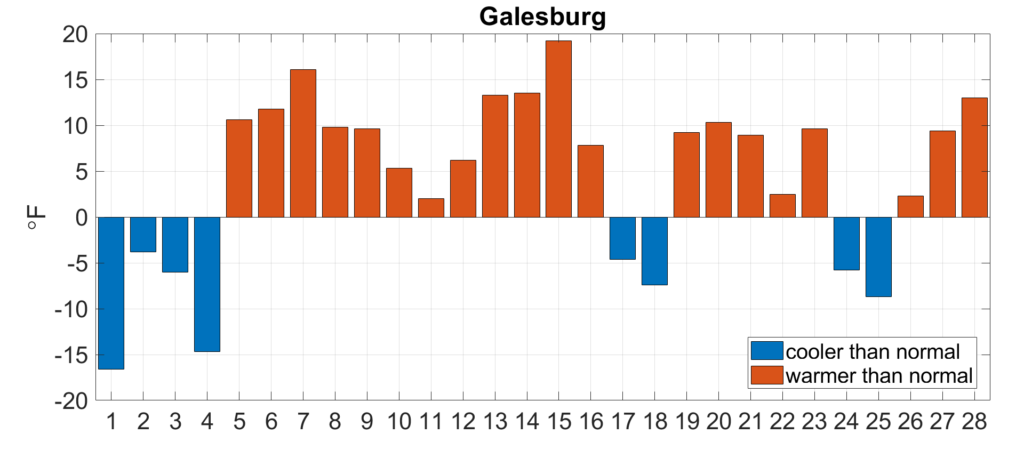
Climatologically, February is the second coldest month statewide after January. February in 2022 and 2021 were much colder than normal, but that trend was broken this year. Figure 1 shows daily temperature departures from normal in Galesburg in February. More than two-thirds of February days in Galesburg were warmer than normal, following a much warmer than normal January.
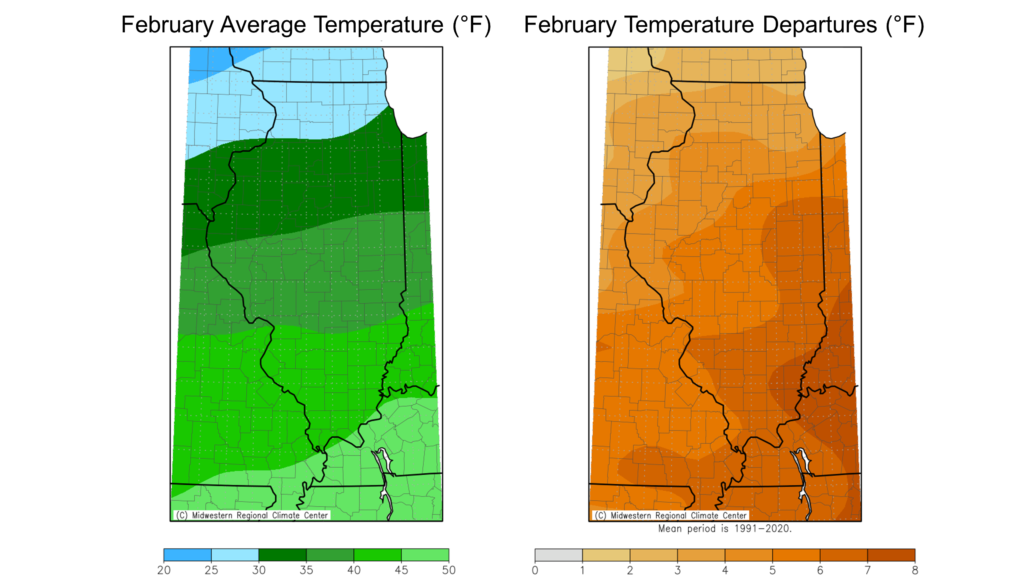
February average temperatures ranged from the high 20s in northern Illinois to the mid-40s in southern Illinois, between 2 and 8 degrees above the 1991–2020 normal (Figure 2). Several stations saw daily high temperatures in the 70s last month, including 74 degrees in Williamson County and 70 in Coles County. Meanwhile, a brief period of extreme cold at the start of the month pushed stations in northern Illinois well below zero, including nighttime lows of -14 degrees in Kane County and -13 degrees in Jo Daviess County. Overall, the warmest place in the state last month was Carbondale, with an average temperature of 44.1 degrees, and the coldest place in the state was Stockton in Jo Daviess County with an average temperature of 25.2 degrees.
The mild weather in February broke 17 daily high maximum temperature records and 11 daily high minimum temperature records. No daily low maximum or daily low minimum temperature records were broken last month.
Overall, the preliminary statewide average February temperature was 35.1 degrees, 4.0 degrees above the 1991–2020 average and tied for the 18th warmest on record going back to 1895.
Where Was Winter?
February wrapped up a very mild climatological winter season, with only a handful of cold air outbreaks and below normal snowfall for most of the state. The near record cold around Christmas pushed December slightly cooler than normal statewide, but the 6th warmest January on record and a top 20 warmest February on record pushed climatological winter average temperatures from somewhat to much warmer than normal.
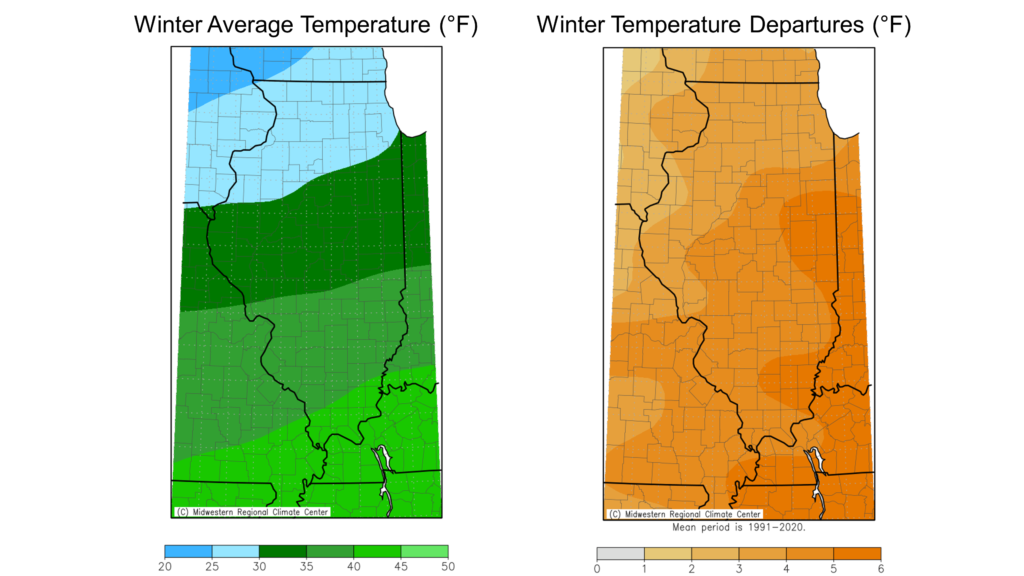
The 2022–2023 climatological winter average temperatures ranged from the high 20s in northern Illinois to the low 40s in southern Illinois, between 2 and 6 degrees above normal (Figure 3). Overall, the preliminary statewide average winter temperature was 33.1 degrees, 4.9 degrees above the 1991–2020 normal and tied with the 2019–2020 season for the ninth warmest on record.
With respect to the long-term historical record, the 2022–2023 winter season was unusually warm. However, the season is part of a long-term warming trend that is larger in winter than in any other season across Illinois. Winter warming is one of the most consistent impacts of anthropogenic climate change in Illinois, driven by human greenhouse gas emissions.
As Figure 4 shows, the statewide average winter temperature has increased by about 0.20 degrees per decade since 1895, and the average winter temperature over the last 30 seasons is about 2 degrees warmer than the 20th century average. One of the consequences of this long-term warming trend is a higher chance of warm winters that would be considered unusual based on the 20th century numbers. For example, six of the top 10 warmest winters on record in Illinois have occurred since 2001–2002.
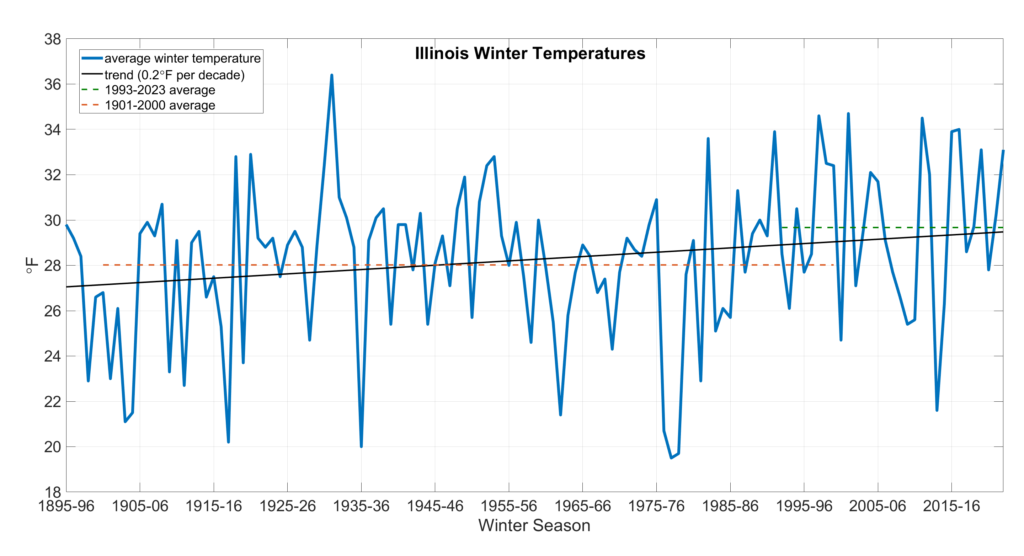
Figure 4. Plot shows statewide average winter temperature in Illinois (blue line), the long-term trend in winter average temperature (black line), the average winter temperature over the last 30 seasons (green line) and the 20th century average (red line).
Wetter February, Again
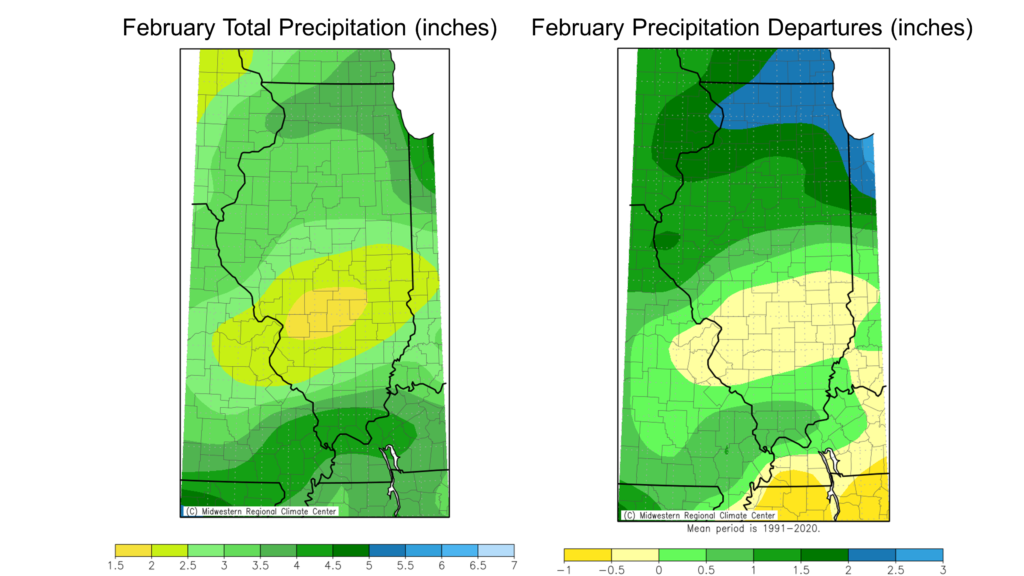
February is one of the climatological driest months of the year; however, the shortest month has come with much wetter weather in recent years, and this year followed that pattern. Total February precipitation ranged from around 2 inches in south-central Illinois to over 4 inches in southern Illinois (Figure 5). The Interstate 70 corridor between St. Louis Metro East and Effingham was near normal to half an inch drier than normal, while most areas north and south were 1 to 3 inches wetter than normal.
Two CoCoRaHS observers in Iroquois County–one in Cissna Park and the other in Milford–observed over 5.5 inches of total precipitation last month, and observers in McLeansboro in Hamilton County and LeRoy in McLean County also recorded more than 5 inches of total precipitation. Meanwhile, many stations between Belleville to Effingham recorded less than 1 inch for the month. Last month was the second wettest February on record in Rockford, third wettest on record in Freeport, fourth wettest on record in Quincy, the seventh wettest on record in Bloomington, and the eighth wettest on record in Chicago and Moline.
Our wet winter eradicated all drought across the state, and the Feb. 28 U.S. Drought Monitor map is completely empty for the first time since June 2020. Drought recovery in southern Illinois was particularly remarkable given that each of the south seven counties were in severe or extreme drought on Dec. 1.
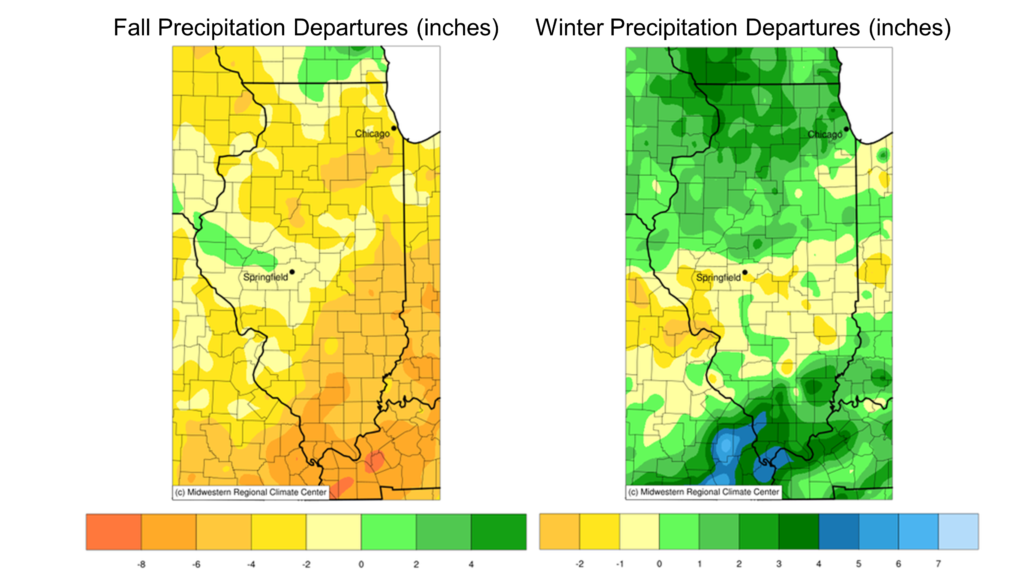
The southeast Illinois climate division experienced its seventh driest climatological fall on record, but then had what is likely going to be a top three wettest winter on record (Figure 6). While drought recovery is always a good thing, the kind of rapid flip in extremes, in this case from extremely dry to extremely wet, is less than ideal.
February Adds to Snow Deficits
February–along with January–is one of the snowiest months of the year climatologically across the state. However, this past month just added to existing snowfall deficits everywhere north of Interstate 64. Below normal snowfall in January and February is typically due to either excessively mild temperatures that result in more rain than snow, or excessively dry conditions that reduce precipitation overall. This past month fell into the former category, with most areas of the state seeing above normal February precipitation, most of which fell as rain or non-accumulating snow.
Overall, only the areas north of Interstate 72 saw any measurable snowfall last month, with totals ranging from less than half an inch from Adams County to Iroquois County up to 12 inches in far northwest Illinois (Figure 7). All but the northwest tip of the state saw below normal snowfall to the tune of 2 to 8 inches less than expected.
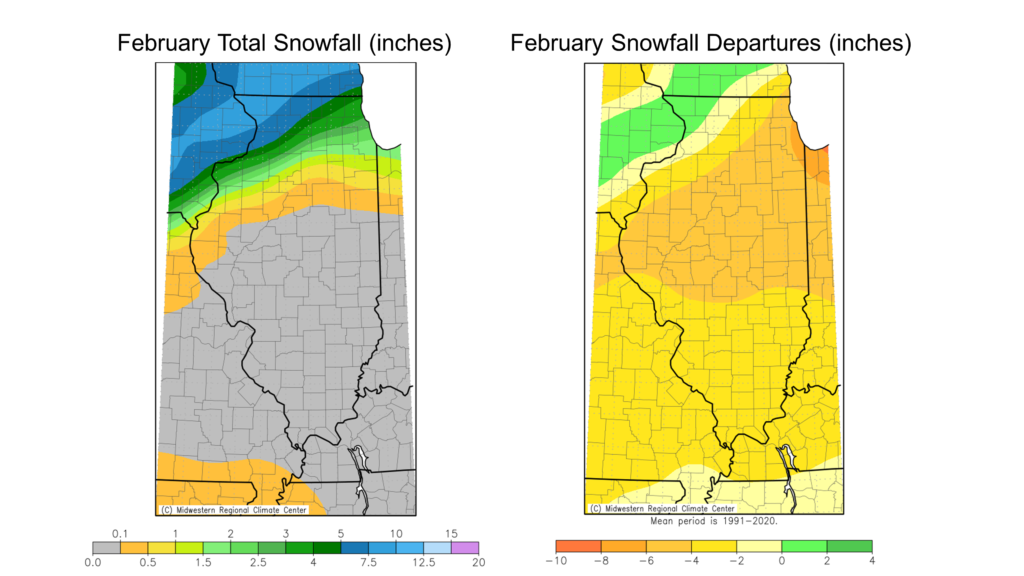
Some of the more impressively weak snowfall totals in February included 0.1 inches in Peoria (fourth lowest on record). Both Springfield and Champaign only recorded trace snowfall for the entire month, meaning no snowfall accumulated to the point it could be measured at greater than or equal to 0.1 inches. Last month was only the sixth February on record in Springfield and the fifth February on record in Champaign with no measurable snowfall; both records go back to the early 1900s.
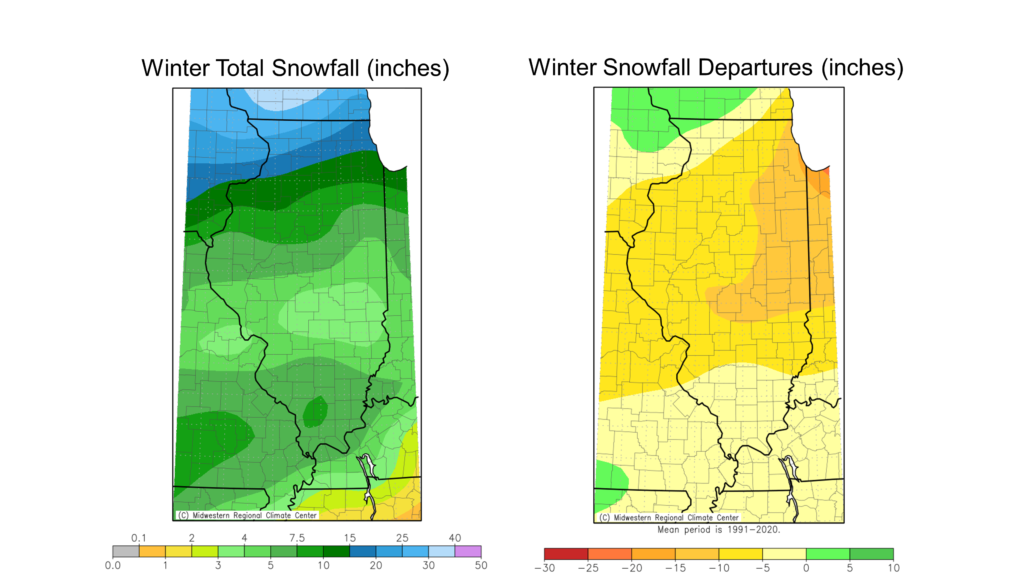
Each of the three months that comprise climatological winter had below normal snowfall for most of the state, and snowfall deficits were particularly large in central and northern Illinois (Figure 8). The 2022–2023 winter snowfall totals ranged from less than 4 inches in parts of central Illinois to just over 25 inches in far northwest Illinois. Much like for February, winter snowfall was near normal for just the northwest tip of the state, 1 to 5 inches less than normal in southern Illinois, and 10 to 20 inches less than normal in central and northeast Illinois. The 2022–2023 winter season was the fifth least snowy on record in Springfield and the seventh least snowy in Champaign.
March & Spring Outlooks
March is the first month of climatological spring, and the first month we typically begin to see signs of spring. Of course, our mild winter has given us sneak peaks to spring already in February, which make the current Climate Prediction Center outlooks more interesting.
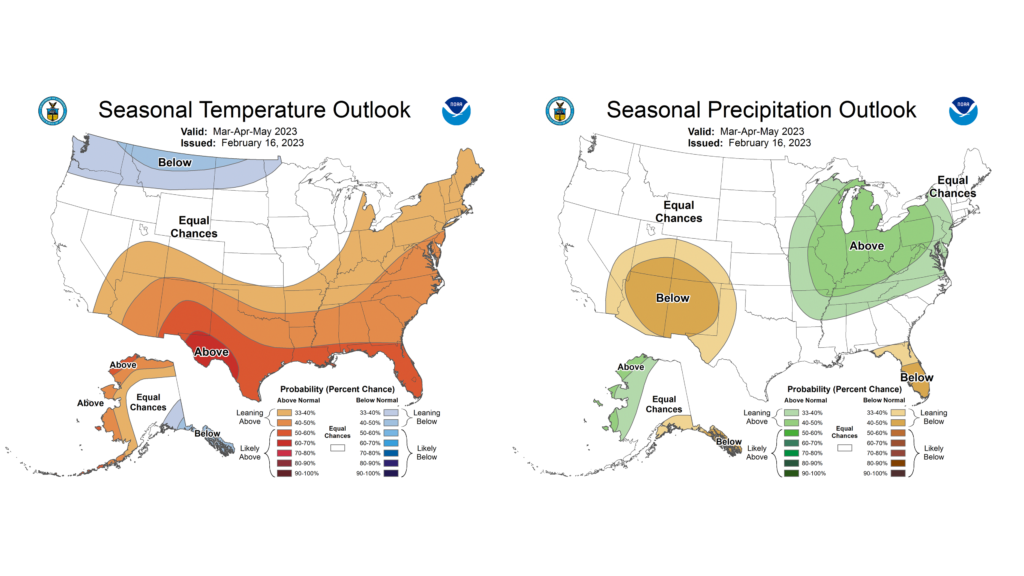
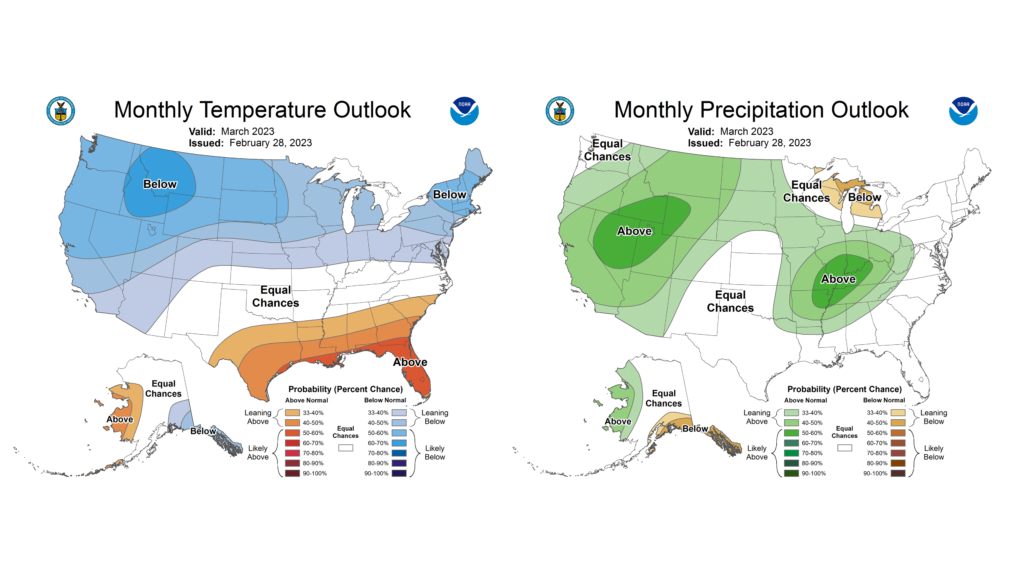
The CPC temperature outlooks lean colder than normal across most of the state, suggesting our unseasonably mild weather may be on hiatus for the third month of the year (Figure 9). One ramification of a cold March for agriculture and spring growth could be a slowdown to our rapid progression toward spring phenology and flowering. Projections of very early spring greenup across the Midwest give heartburn to tree fruit and berry growers and gardeners alike who want to avoid untimely spring freeze damage. Precipitation outlooks for March are leaning to likely wetter than normal, possibly continuing our wet streak from January and February.
The spring season outlooks (March–May) show closer to equal chances of above and below normal temperatures, suggesting the colder weather potential for March may not bleed into April or May. Most folks would prefer not to repeat the cool and cloudy April we had in 2022. Meanwhile, the green blob in the eastern Midwest persists in the spring outlooks (Figure 10). Soils in most of the state are bordering between being in good shape and being a tad too wet. Wetter than normal conditions in spring could make for some challenges for spring planting and other fieldwork, which have become a perennial problem for southern Illinois especially.