The preliminary statewide average January temperature was 33.8 degrees, 7.1 degrees above the 1991–2020 average and the 6th warmest on record going back to 1895. The preliminary statewide average total January precipitation was 2.72 inches, 0.41 inches above the 1991–2020 average and the 31st wettest on record statewide.
Data are provisional and may change slightly over time.
Where is Winter?
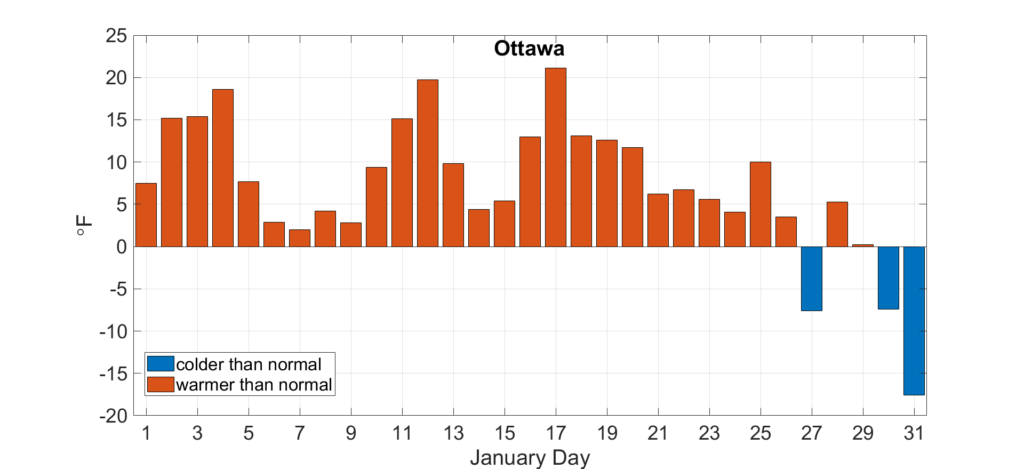
January brought widespread and persistent mild weather, with temperatures regularly 5 to 10 degrees above normal and a few days 15 to 20 degrees above normal. Figure 1 shows daily average temperatures last month in Ottawa. Only three out of 31 January days had below normal temperatures in Ottawa, and each of the first 26 days of the month were warmer than normal.
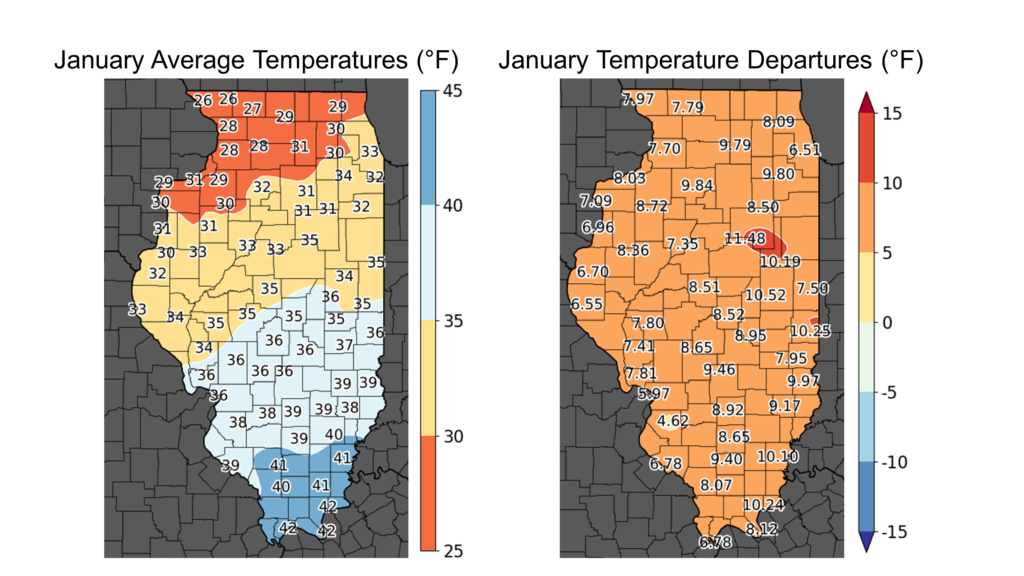
Although temperatures were not warm by any means, they were noticeably milder than expected in the first month of the year. January average temperatures ranged from the mid-20s in northwest Illinois to the low 40s in southern Illinois, between 5 and 12 degrees above normal (Figure 2). Last month was the fifth warmest January on record in Peoria and Carbondale, the sixth warmest on record in Chicago, and the seventh warmest on record in Moline, Springfield, and St. Louis. Following long-term warming trends, the nighttime low temperatures last month were particularly unusual. The average nighttime low temperature in Peoria in January was the third highest on record.
Overall, the preliminary statewide average January temperature was 33.8 degrees, 7.1 degrees above the 1991–2020 average and the sixth warmest on record going back to 1895.
Wetter January, but still not much snow
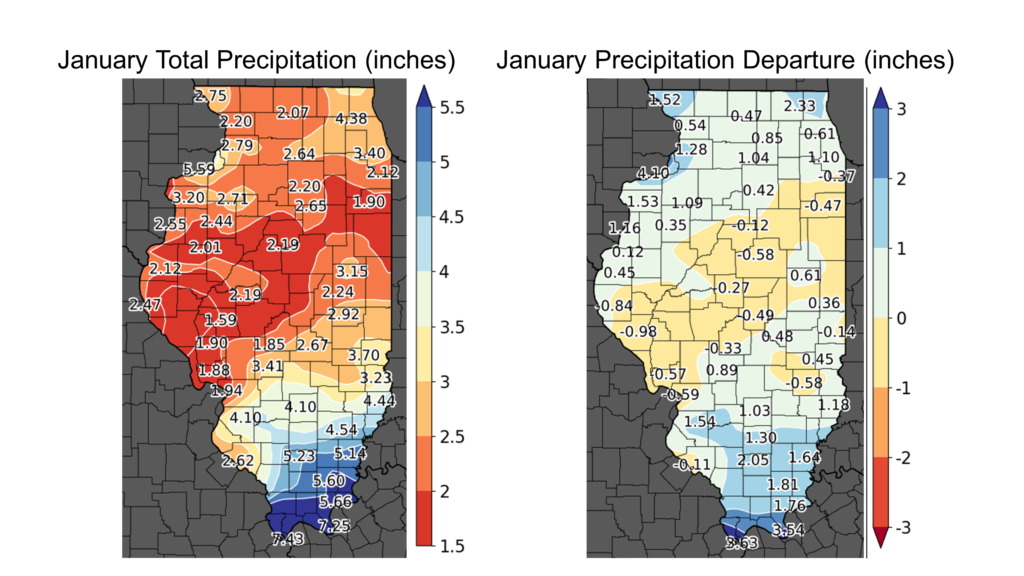
August 2022 was the last month that was wetter than normal statewide. January is not typically a wet month, but relative to its spring and summer counterparts, this past month brought wetter weather to most of the state. January’s total precipitation ranged from around 2 inches in west-central Illinois to over 7 inches in far southern Illinois. Most parts of northern and southern Illinois were between 0.5 and 2 inches wetter than normal, while much of central Illinois was near to 0.5 inches drier than normal last month (Figure 3). Overall, the preliminary statewide average total January precipitation was 2.72 inches, 0.41 inches above the 1991–2020 average and the 31st wettest on record statewide.
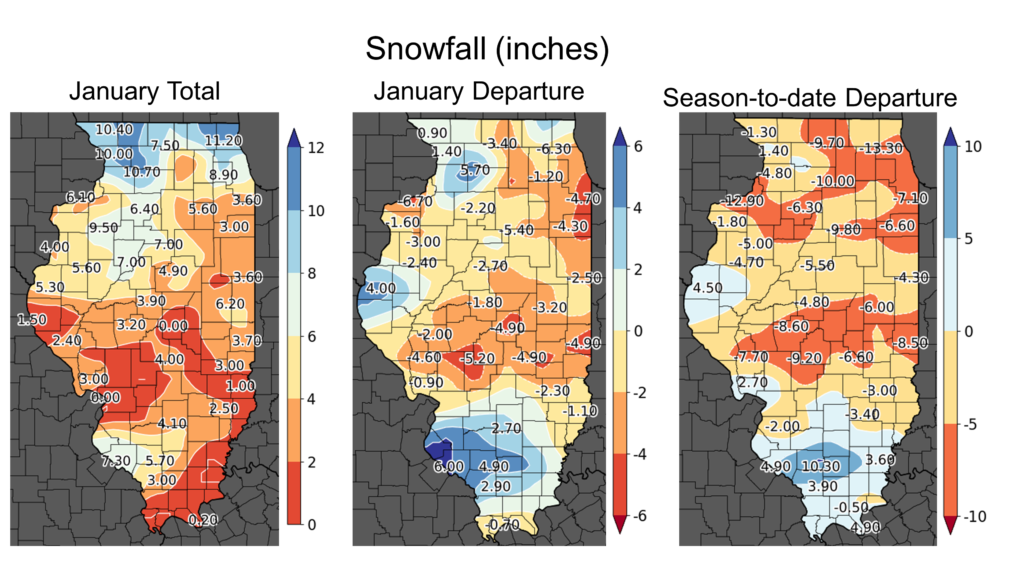
The milder January temperatures kept heavy snow at bay for most of the month. January snowfall totals ranged from around 3 inches in southern and south-central Illinois to just under 12 inches in northeast Illinois. Only southern and parts of northeast Illinois had near to above normal snowfall, while the rest of the state had 1 to 6 inches below normal snowfall for the month. The general lack of sizeable January snowfall added to November and December deficits. Season-to-date snowfall remains above normal in southern Illinois, but 3 to 13 inches below normal in central and northern Illinois (Figure 4).
Outlooks
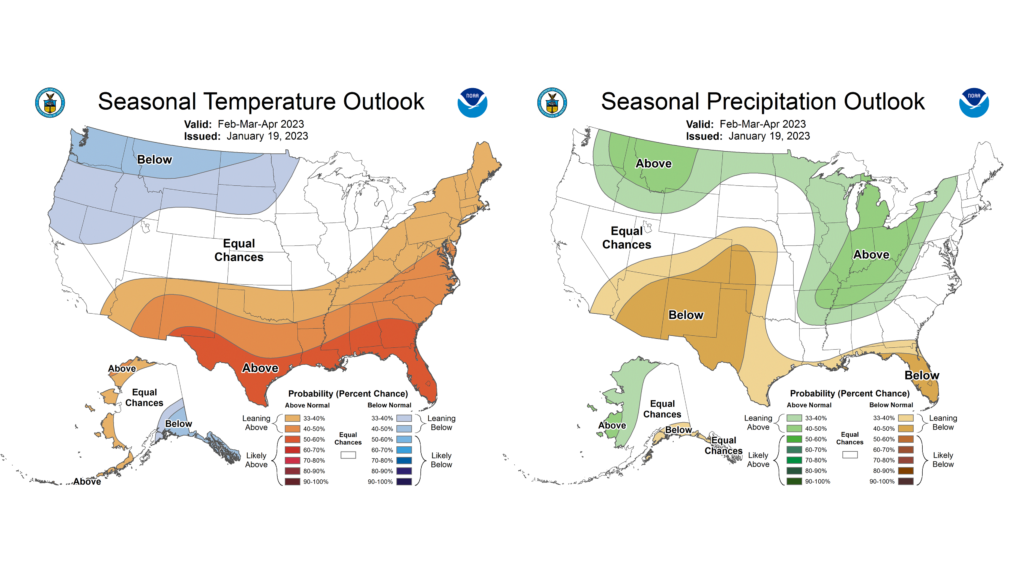
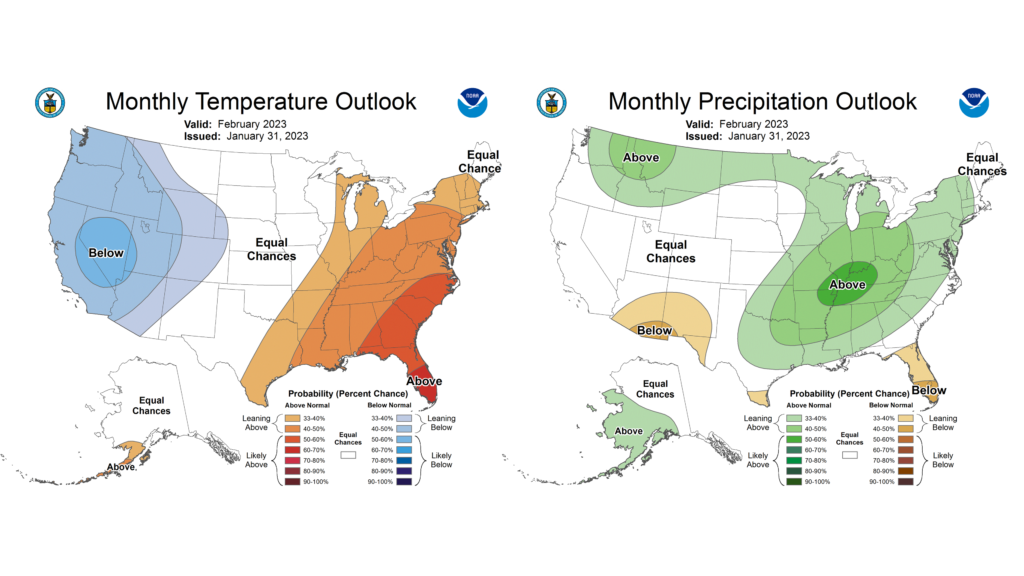
February marks the last month of winter, and likely our last chance for significant snowfall, especially in central and southern Illinois. Climate Prediction Center outlooks for February lean to warmer and wetter than normal conditions, as the atmosphere hangs on to the signal of a quickly weakening La Niña (Figure 5). Odds of wetter than normal conditions are particularly high in far southern Illinois, a region that experienced a very wet February last year.
Meanwhile, outlooks for the three-month period between February and April are also leaning to likely wetter than normal statewide, but with equal chances of above or below normal temperatures (Figure 6). The consistent signal of wetter than normal conditions for the end of winter and start of spring would continue making up for precipitation deficits from last fall; however, it also means we’ll need to keep our eye on the potential for excessive wetness and flooding this spring.