
The preliminary statewide average November temperature was 40.7 degrees, 1.0 degrees below the 1991–2020 average and 53rd coldest on record going back to 1895. The preliminary statewide average total November precipitation was 1.00 inches, 2.31 inches below the 1991–2020 average and the 9th driest on record.
Data are provisional and may change slightly over time
Typically Atypical November Temperatures
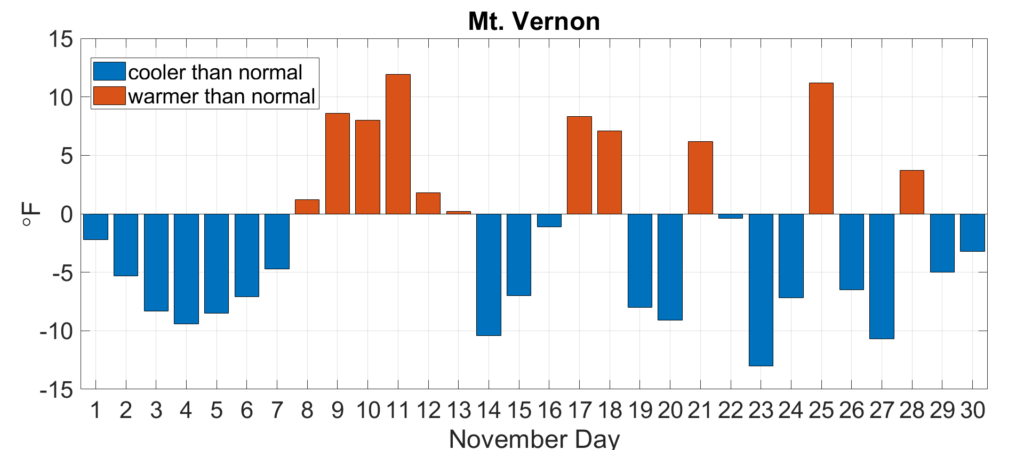
November is a month of change and of variability. Cool air moves in from the northwest and competes with the warmer, southerly air masses that dominate earlier in the fall. Therefore, the archetype of November temperatures is variability, and this month followed suit.
Figure 1 shows daily temperature departures from normal in Mt. Vernon. Following a very warm October, the first week of November was 5 to 8 degrees cooler than normal. Temperatures climbed back above normal in the second week of the month, but then followed a consistent back and forth variation between cooler and warmer weather.
November average temperatures ranged from the high 30s in northern Illinois to the low 40s in southern Illinois, between 1 and 4 degrees below the 1991–2020 normal (Figure 2). Several stations saw daily high temperatures in the 70s early in November, including a 75-degree high in Randolph County. Meanwhile, several stations in northern and central Illinois reached nighttime minimum temperatures well below 20 degrees, including a 10-degree low in Knox and Warren Counties. Mild temperatures this past month did not break any local daily high maximum or high minimum temperature records in Illinois; however, the daily low minimum temperature records on November 4 and 5 were broken in Casey in Cumberland County.
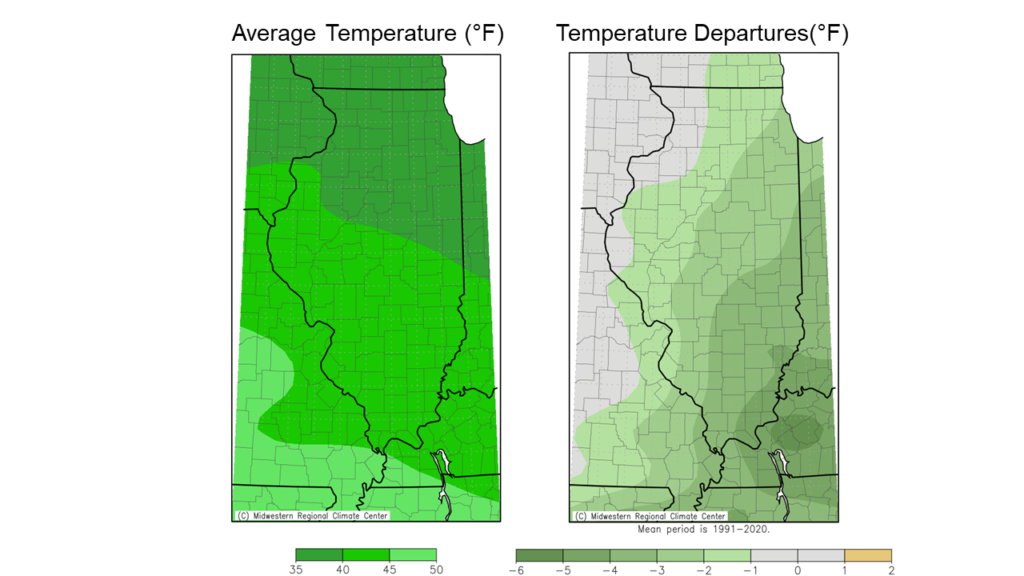
Overall, the preliminary statewide average November temperature was 40.7 degrees, 1.0 degrees below the 1991–2020 average and 53rd coldest on record going back to 1895.
November wrapped up the climatological fall season. Despite the cooler weather in November, fall temperatures were 1 to 4 degrees above normal with the largest departures in northern Illinois (Figure 3).
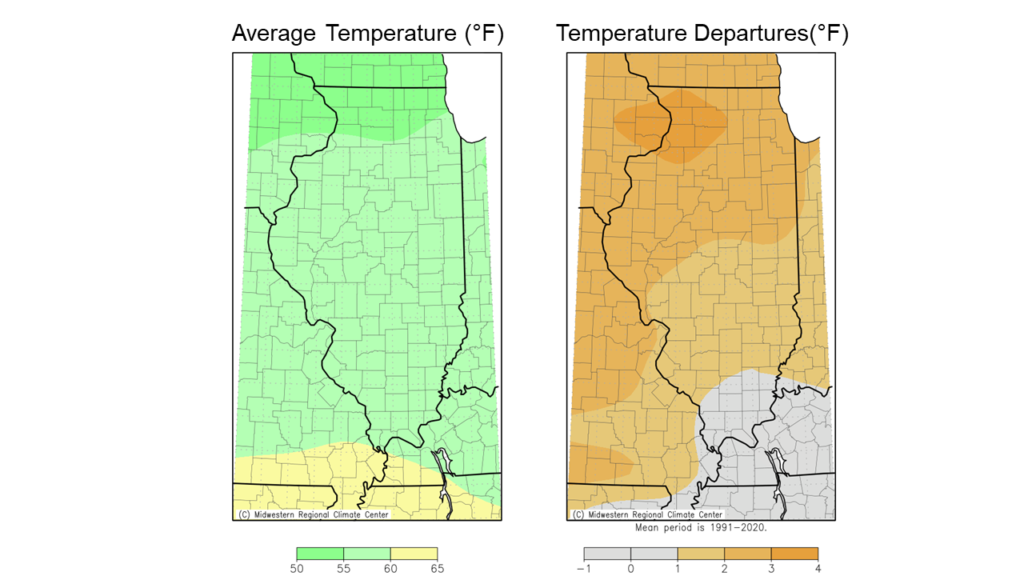
Figure 3. Maps of (left) fall average temperature and (right) fall average temperature departures from normal.
Dry November
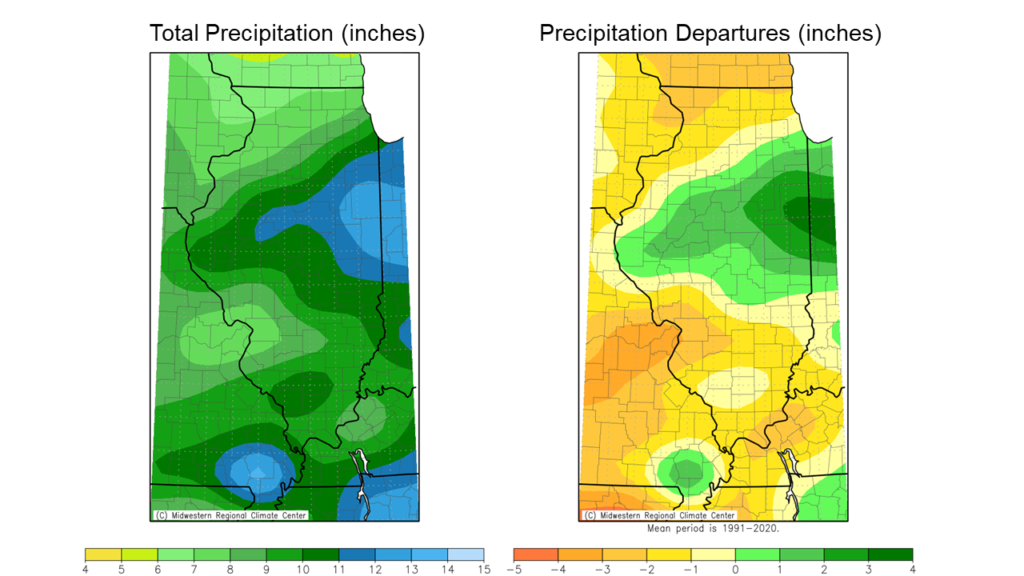
The taps turned off across the state following the fourth wettest October on record statewide. Total November precipitation ranged from less than a quarter of an inch in northwest Illinois to just over 2 inches in southeast Illinois, between 2 and 4 inches below normal (Figure 4). This past month was the second driest on record in Rockford, with only 0.45 inches, and the third driest on record in St. Louis with only 0.35 inches.
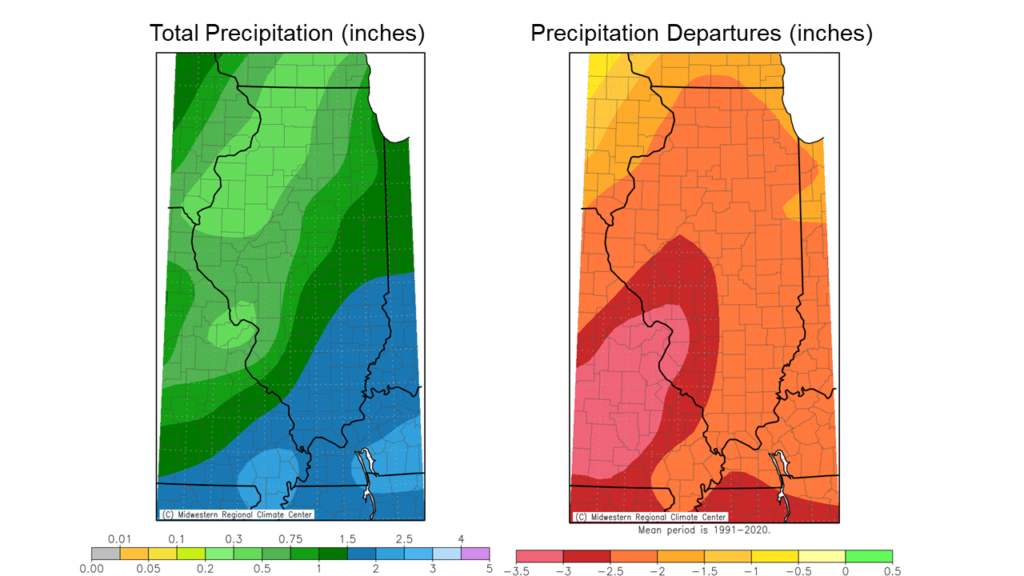
Figure 4. Maps show (left) total November precipitation and (right) November precipitation departure from normal.
The dry conditions added to existing precipitation deficits in northern Illinois, and in response we did not see much change in the U.S. Drought Monitor this past month. Most areas between Whiteside County in northwest Illinois and Lake County in northeast Illinois remain in moderate to severe drought as year-to-date precipitation deficits of 6 to 12 inches remain. January 1 through November 30 is the second driest on record in Rockford, greater only than 2012. Rockford will need at least 1.11 inches of precipitation in December to keep 2021 from being the driest calendar year on record there.
The preliminary statewide average total November precipitation was 1.00 inches, 2.31 inches below the 1991–2020 average and the ninth driest on record going back to 1895.
The climatological fall total precipitation ranged from just over 6 inches in northwest Illinois to over 13 inches in eastern Illinois. Fall was 1 to 4 inches drier than normal in most of northern and southern Illinois and between 1 and 4 inches wetter than normal in central Illinois (Figure 5).
December & Winter Outlooks
December is the official start of climatological winter. The most recent December outlooks from the Climate Prediction Center are leaning into a warmer than normal start to winter with an equal chance of above and below normal precipitation for December (Figure 6).
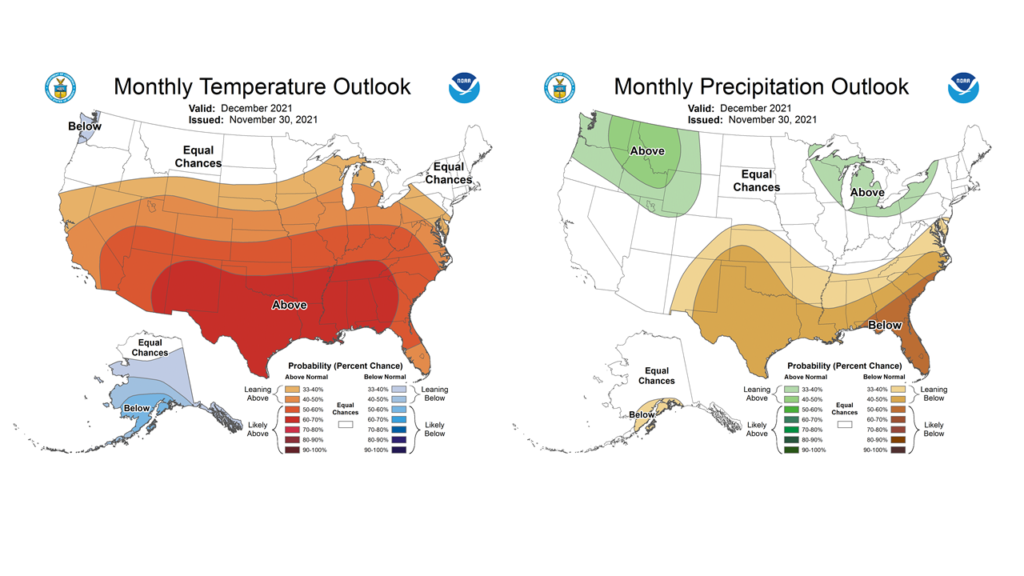
Figure 6. Climate Prediction Center (left) temperature and (right) precipitation outlooks for December.
Revised outlooks for the climatological winter, December through February, are still showing a La Niña pattern with the highest likelihood of a warmer and wetter winter overall (Figure 7).
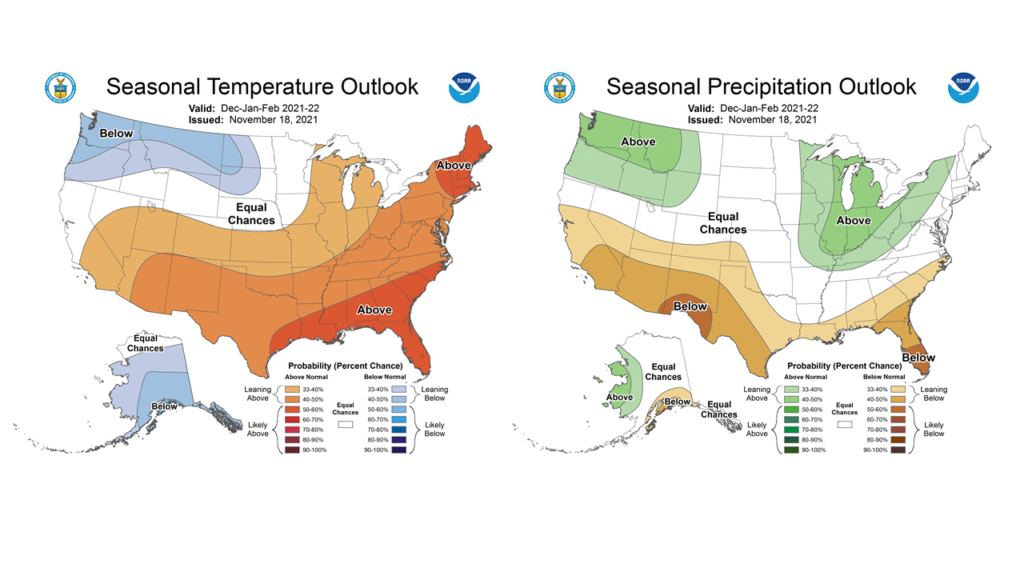
Figure 7. Climate Prediction Center (left) temperature and (right) precipitation outlooks for December through February.