The preliminary statewide average October temperature was 59.7 degrees, 5.1 degrees above the 1991–2020 average and eighth warmest on record going back to 1895. The preliminary statewide average total October precipitation was 6.36 inches, 3.44 inches above the 1991–2020 average and the fourth wettest on record going back to 1895.
Data are provisional and may change slightly over time
Very Warm Start to October
Following a warm start to fall in September, temperatures were consistently 5 to 10 degrees above normal for the first half of October. Figure 1 shows the daily temperature departure from normal in Quincy.
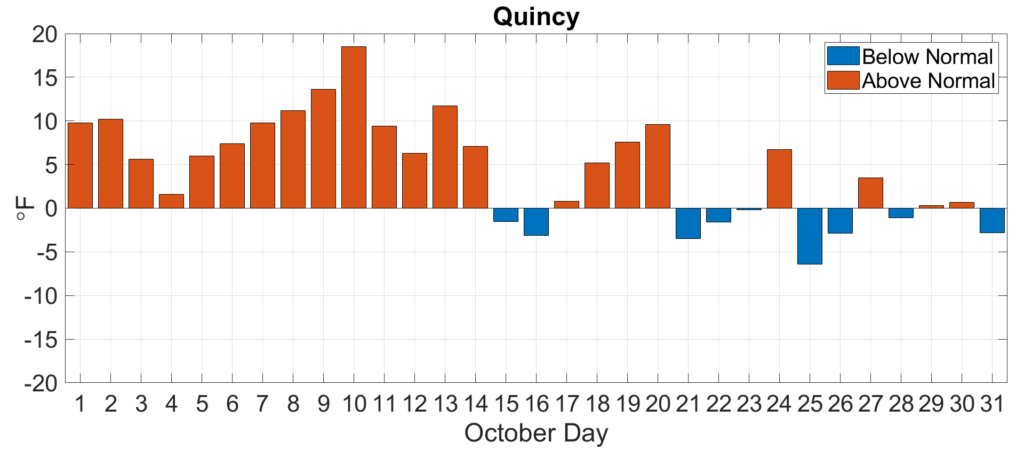
Figure 2 shows October average temperatures and average daily mean minimum and maximum temperature departures. Although daily average and daily maximum temperatures were both above normal in October statewide, nighttime minimum temperatures had the highest departures. October average daily minimum temperatures ranged from 5 to 9 degrees above average in Illinois. The average nighttime minimum temperature last month was the highest on record in Chicago, Peoria, and Paducah and the top five highest on record in Rockford, the Quad Cities, Quincy, and St. Louis.

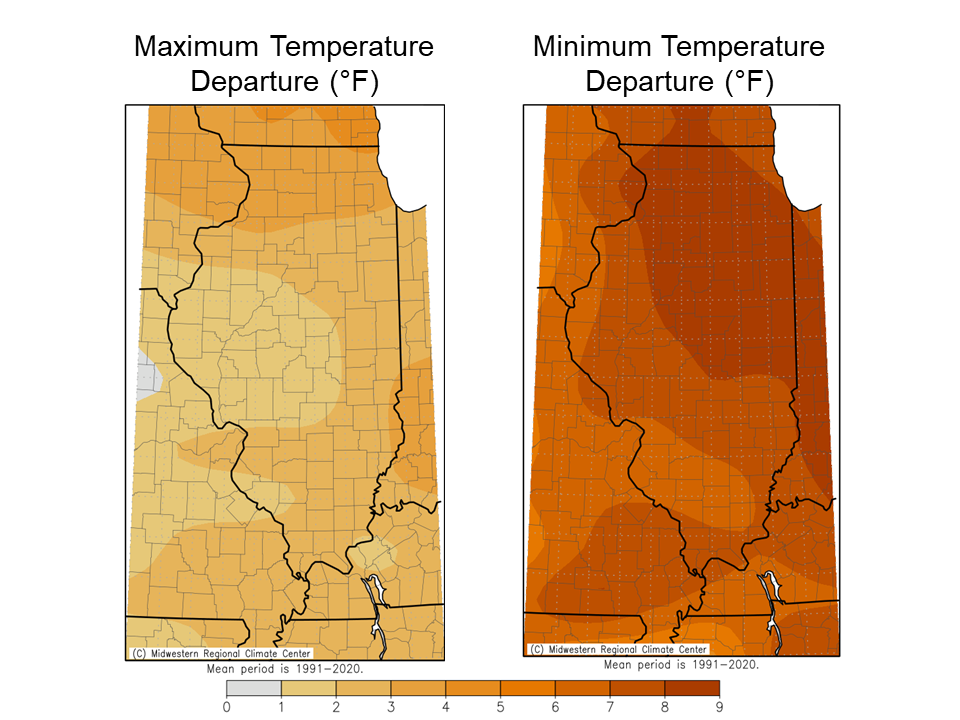
The highest temperature observed in October was 91 degrees in Congerville in Woodford County, and the lowest temperature was 24 degrees in Galena in Jo Daviess County. The unusually warm weather in October broke 13 daily high maximum temperature records and 58 daily high minimum temperature records. No daily low maximum or low minimum temperature records were broken last month.
Overall, the preliminary statewide average October temperature was 59.7 degrees, 5.1 degrees above the 1991–2020 average and the eighth warmest on record going back to 1895.
Soggy October
Following a very dry September for most of northern Illinois, the taps opened in October and created persistently soggy conditions. For example, Champaign recorded 19 “wet days” in October, those in which at least 0.01 inches of precipitation are observed, which was the third most on record.
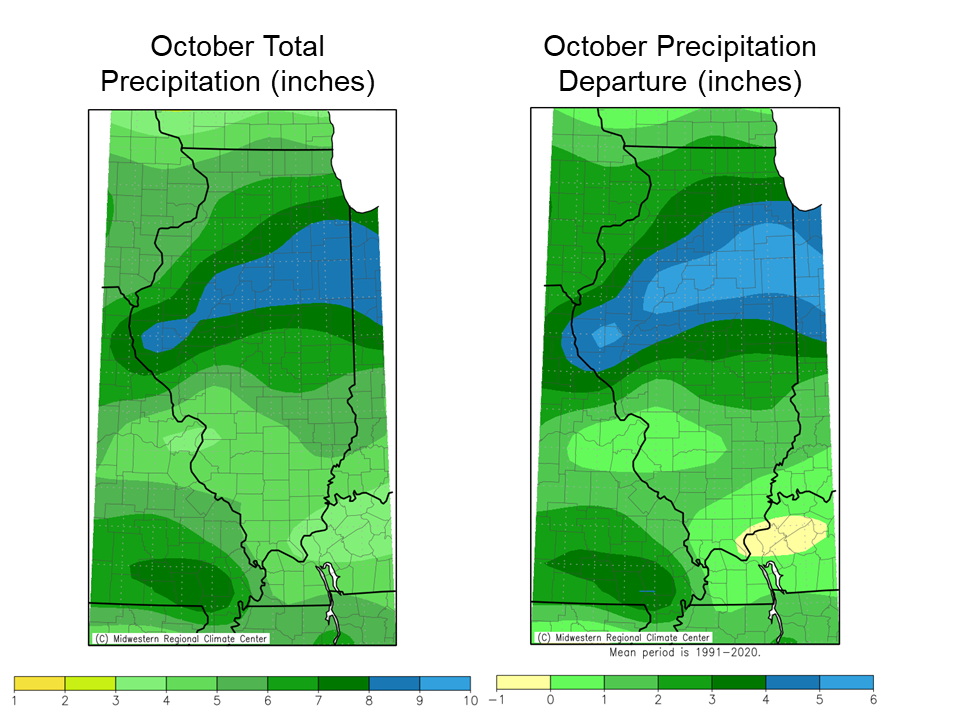
The persistently wet conditions resulted in monthly totals ranging from 3.5 inches in southwest and far southeast Illinois to over 9 inches in parts of north-central Illinois (Figure 3). While southern Illinois was between 1 and 3 inches wetter than normal last month, parts of central and northern Illinois were 3 to 6 inches wetter than normal. It was the second wettest October on record in Peoria and Quincy and the fifth wettest in Springfield.
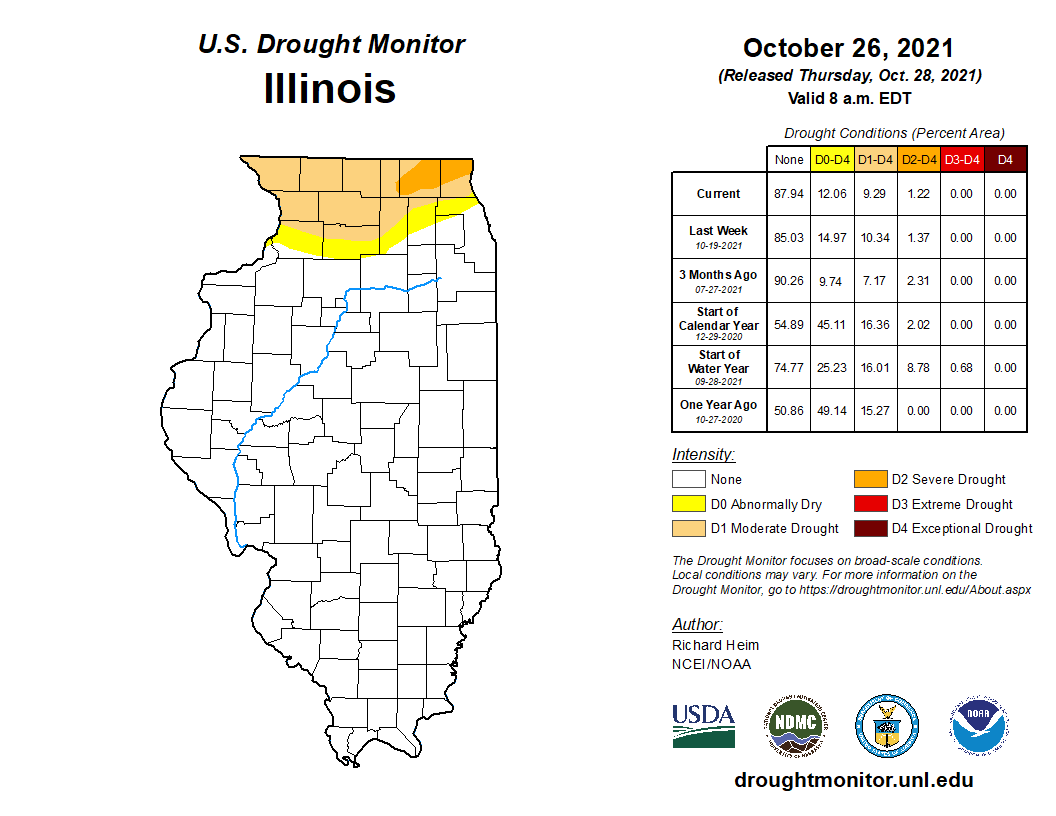
Although the rain put October harvest on hiatus, it was greatly beneficial to improving drought conditions in northern Illinois. Soil moisture and streamflow were both boosted by the wet conditions last month. The U.S. Drought Monitor showed improved drought conditions throughout much of northern Illinois in the most recent map (Figure 4). The percentage of the state in at least severe drought (D2) declined from 8.78 percent on October 1 to 1.22 percent in the most current map.
However, most areas between Whiteside County in northwest Illinois and Lake County in northeast Illinois remain in moderate to severe drought, as year-to-date precipitation deficits of 5 to 10 inches remain. Wetter weather will need to prevail throughout winter to terminate the northern Illinois drought, but October was a big step in the right direction.
Overall, the preliminary statewide average total October precipitation was 6.36 inches, 3.44 inches above the 1991–2020 average and the fourth wettest on record going back to 1895.
November and Winter Outlooks
The gap between the 30-year normal October average temperature and September average temperature is the largest of any two months statewide, at 11.5 degrees. This means that as we look ahead, irrespective of the outlook, temperatures will decrease as we move into November.
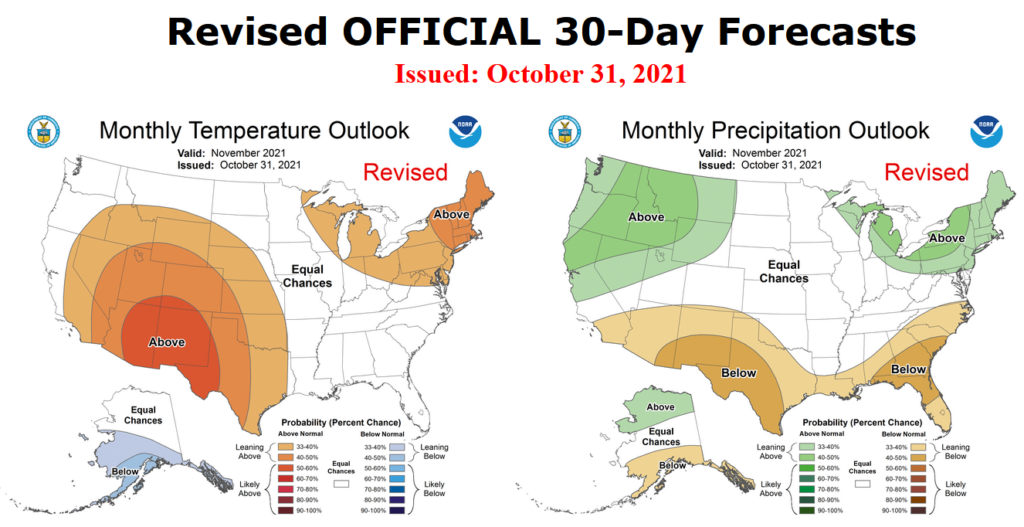
With that said, the most recent Climate Prediction Center outlooks for the whole month of November show equal chances of above and below normal temperatures and precipitation across the state (Figure 5).
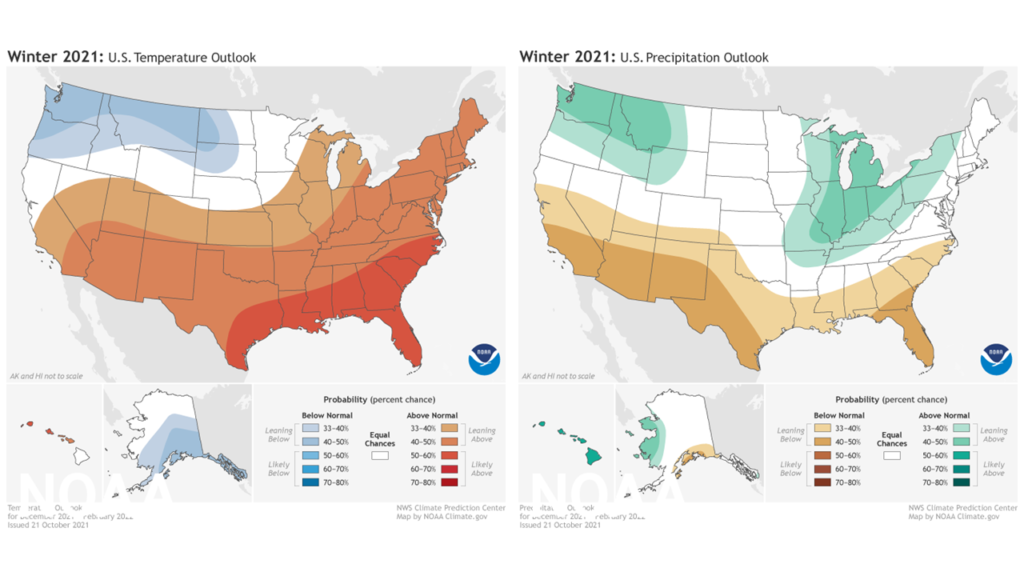
The end of October also brought the Climate Prediction Center’s sought-after climatological winter (December–February) outlooks. Following a typical La Niña pattern, the outlooks show the highest odds of a warmer and wetter than normal winter across the state (Figure 6).