June was warmer and drier than average across the state. The preliminary statewide average June temperature was 73.7 degrees, 1.8 degrees above the 30-year normal and tied for the 26th warmest on record going back to 1895. The preliminary statewide average total June precipitation was 3.70 inches, 0.51 inches below the 30-year normal and the 48th driest on record.
Data are provisional and may change slightly over time
Persistent Above Average Temperatures Last Month
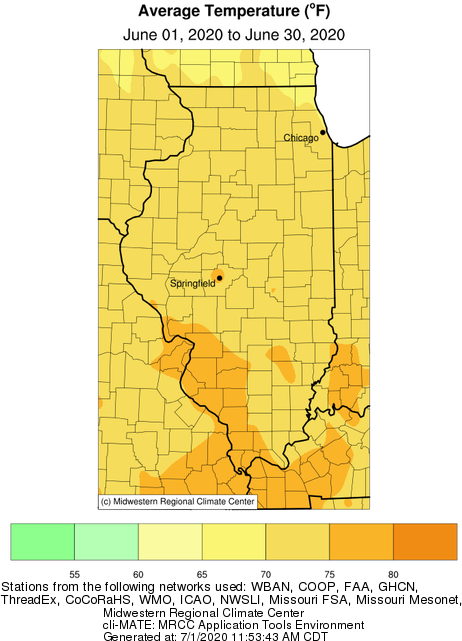
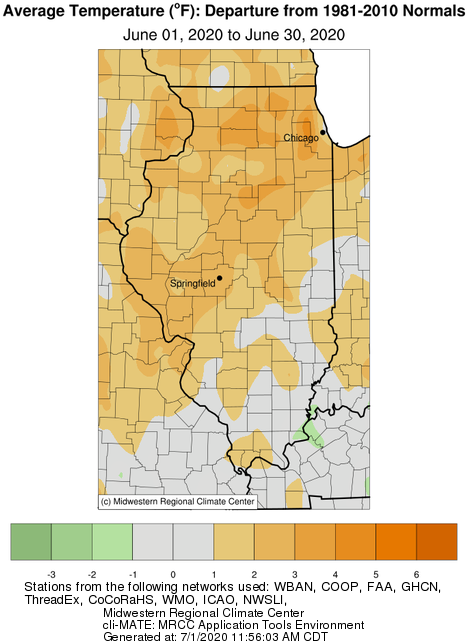
June was warmer than normal for most of the northern two-thirds of the state following a warm end to May. June average temperatures ranged from the high 60s in northern Illinois to the high 70s in southern Illinois. In the northern part of the state, June was 1 to 6 degrees warmer than normal, with the highest departures in northern and northeast Illinois.
The highest temperature recorded in Illinois last month was 99 degrees in Cook County on June 20. In contrast, a few cloudless nights following a strong cold front in the middle of the month resulted in several stations recording minimum temperatures in the 40s, including 43 degrees in McHenry County on June 15.
Overall, 20 daily high maximum temperature records were broken last month, including a 148-year-old daily maximum temperature record on June 2 at Rock Island Lock and Dam. High humidity throughout the state also resulted in 31 daily high minimum temperature records broken last month, including a daily record 76-degree minimum temperature in Olney on June 10.
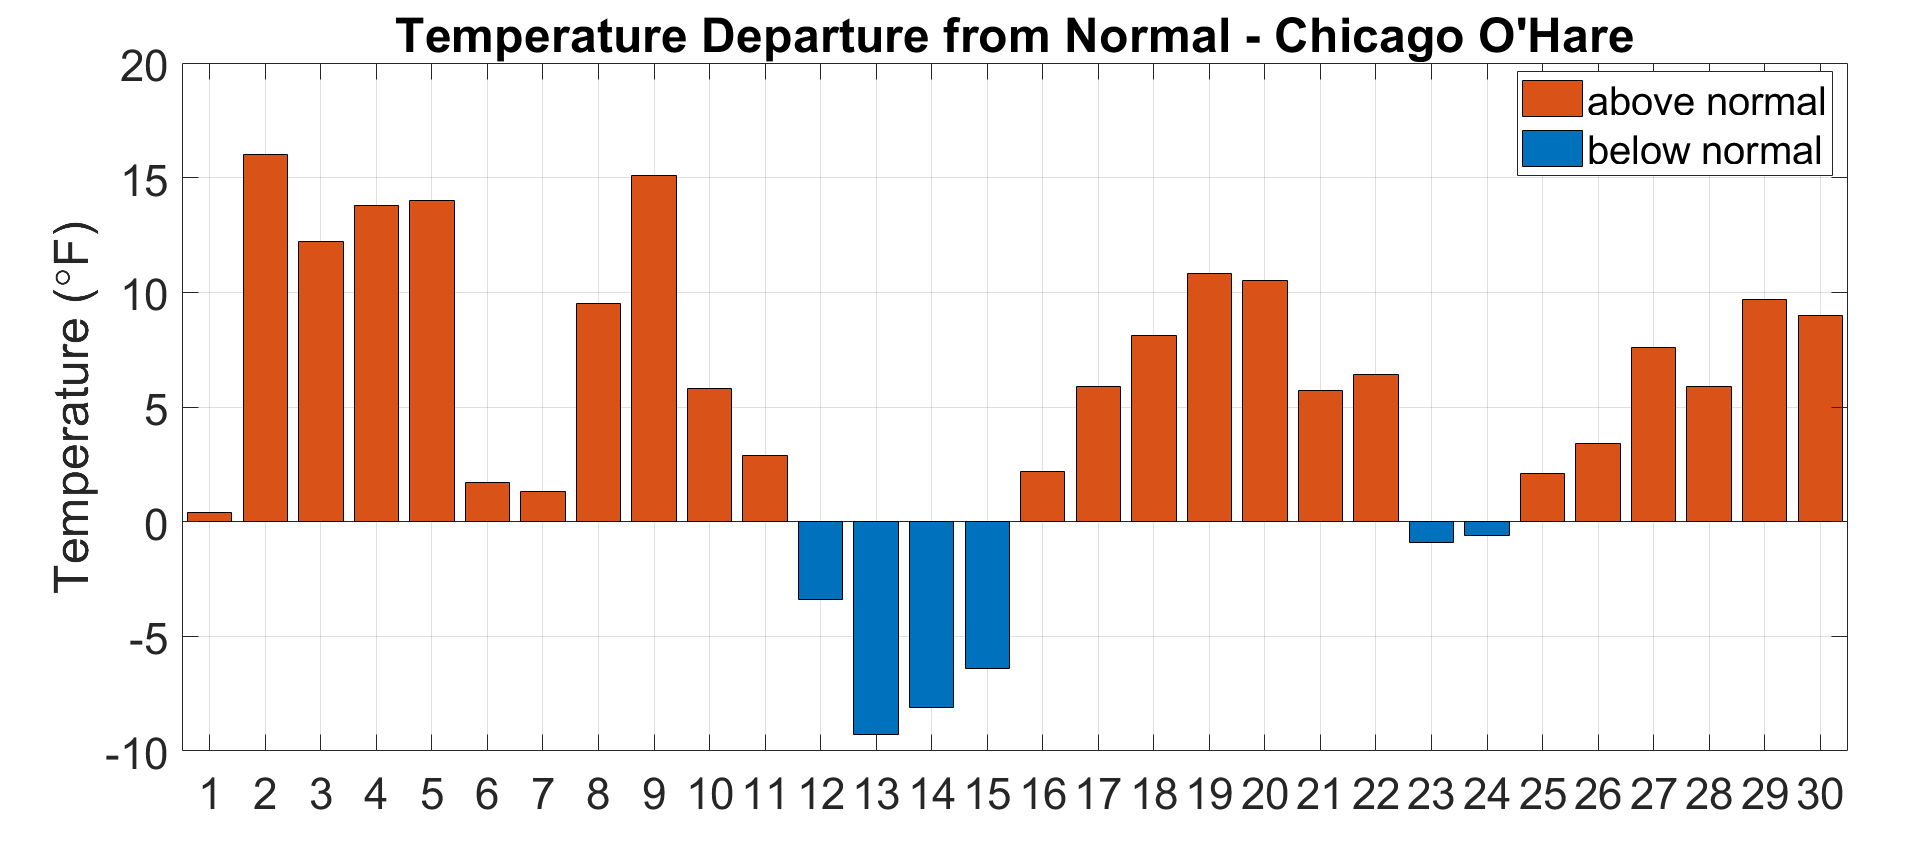
The station at Chicago’s O’Hare airport only recorded six days in June with an average temperature below the long-term daily mean (see plot below). The average June temperature at O’Hare of 74 degrees tied 2012 for the second warmest on record, following only the 74.2-degree average of June 2005. The June average daily maximum temperature at O’Hare was 84 degrees, which was the sixth highest on record. It should be noted that the O’Hare temperature record only goes back to 1958, and therefore does not include the 1930s during which most summer high temperature records were set in Illinois.
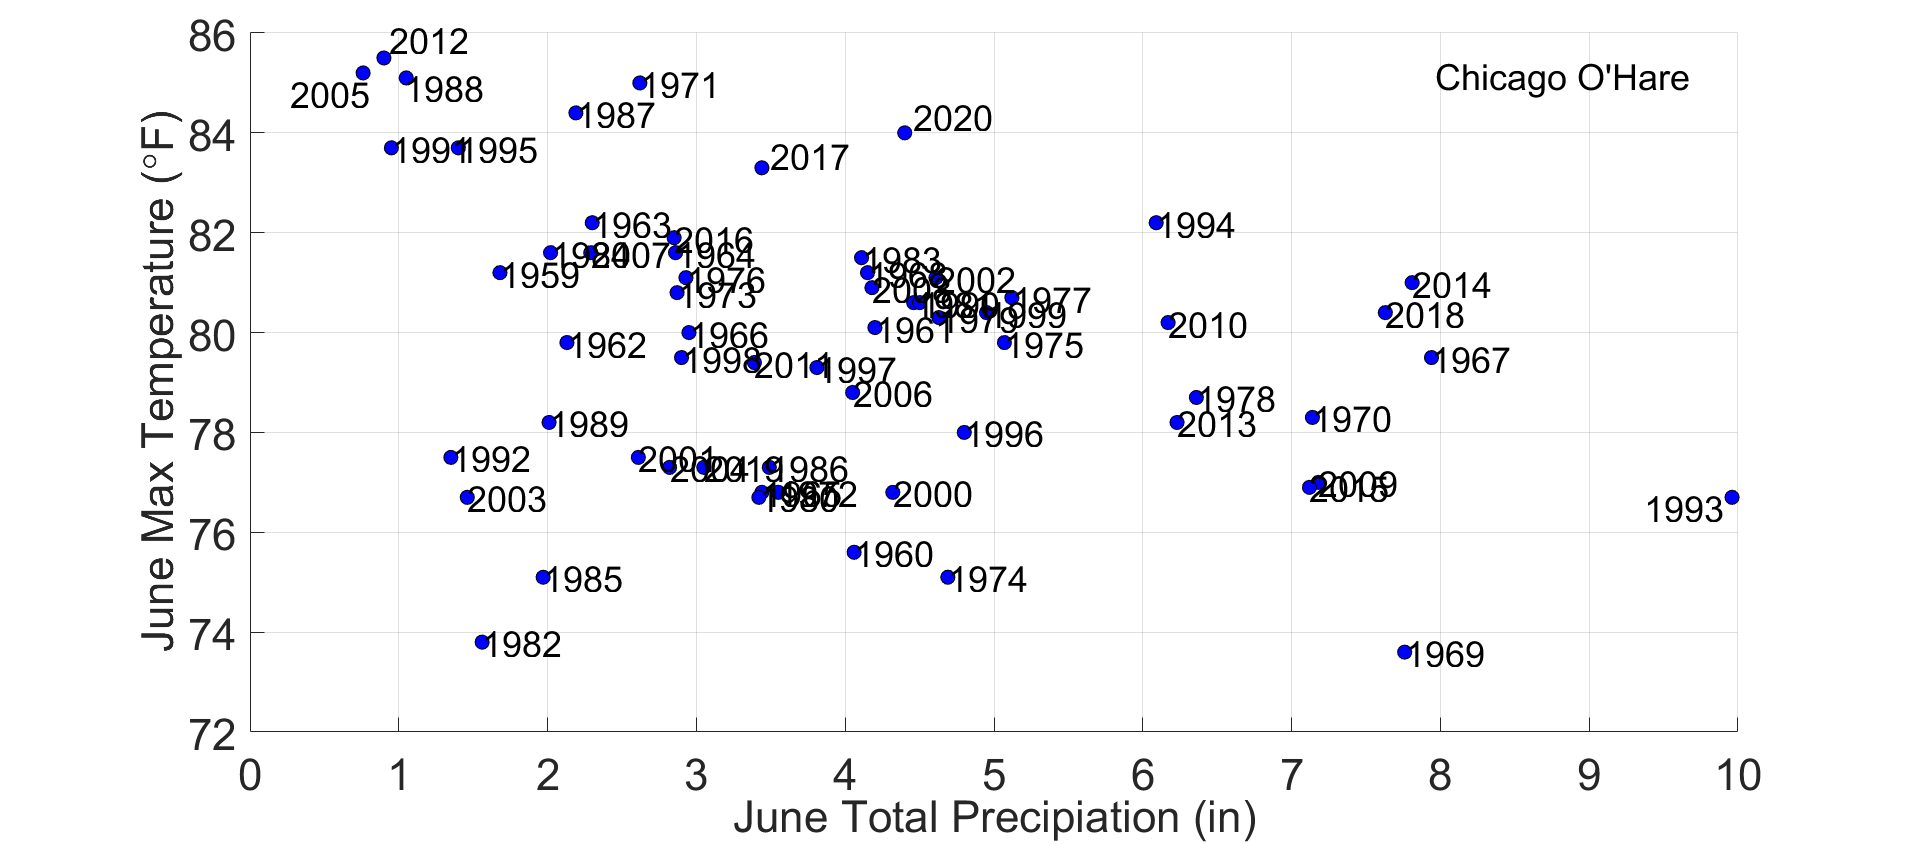
Because of the heightened influence of the land surface on temperature during the summertime in Illinois, monthly precipitation and air temperature (particularly daily maximum temperature) are often negatively correlated. Drier summer months tend to result in reduced soil moisture, which can also decrease evaporation and increase air temperature. This is why the driest summers (think 1988, 2005, 2012) are also frequently the warmest summers. The graph below shows the total June precipitation on the x-axis and average daily maximum June temperature on the y-axis, both from the station at O’Hare. Each scatter point represents a calendar year from 1959 to 2020. In general, wetter Junes correspond with lower maximum temperatures in Chicago. However, despite last month being slightly wetter than average in Chicago, it was much warmer than average.
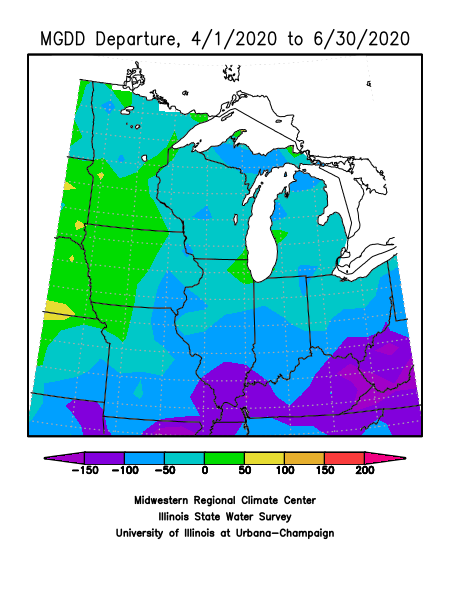
The added heat last month helped crops progress after well below normal temperatures in May. However, base 50 growing degree days since April 1 are still below normal across the state and well below normal in southern Illinois.
June: Dry for Most, Very Wet for Some
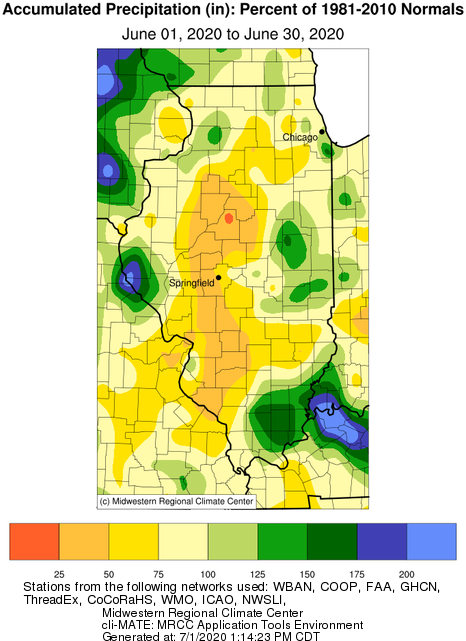
Most summer precipitation in Illinois comes from local- to meso-scale systems, such as convective thunderstorms. These storms can produce large precipitation totals over short time periods but typically only affect a small geographic area. This can result in a “have and have not” summer precipitation pattern, which is what occurred last month.
The June total precipitation ranged from over 8 inches in parts of western and east-central Illinois to less than an inch in central and south-central Illinois. The totals represented between 200 percent and less than 25 percent of normal June precipitation. For example, only 60 miles separates COOP stations in Fisher in Champaign County, which recorded over 8 inches of precipitation in June and Morton in Tazewell County, which recorded just 0.52 inches in June.

High humidity and active large-scale atmospheric patterns resulted in several instances of thunderstorm-driven heavy precipitation across the state last month. Six stations recorded single-day precipitation totals of over 4 inches. This included 4.48 inches of rainfall recorded in West Frankfort in Franklin County, which was the seventh highest single-day total since precipitation observations began at that station in 1972. Heavy precipitation in Adams and Pike counties resulted in two different flash flood warnings, one on June 21 and a second on June 30.
In contrast to the few areas of wet extremes last month, most of the state was drier than normal, including a few areas with less than 25 percent normal June rainfall. The station in Highland in Madison County experienced their driest June on record going back to 1977. Incredibly, the same station in Highland recorded nearly 3.5 inches more precipitation than normal in January and May of this year and, despite the very dry June, is still well above 100 percent of normal precipitation for the first six months of the year. Thankfully, this station also recorded over 2 inches of rainfall on July 1, helping reduce some of the dryness from the previous month.
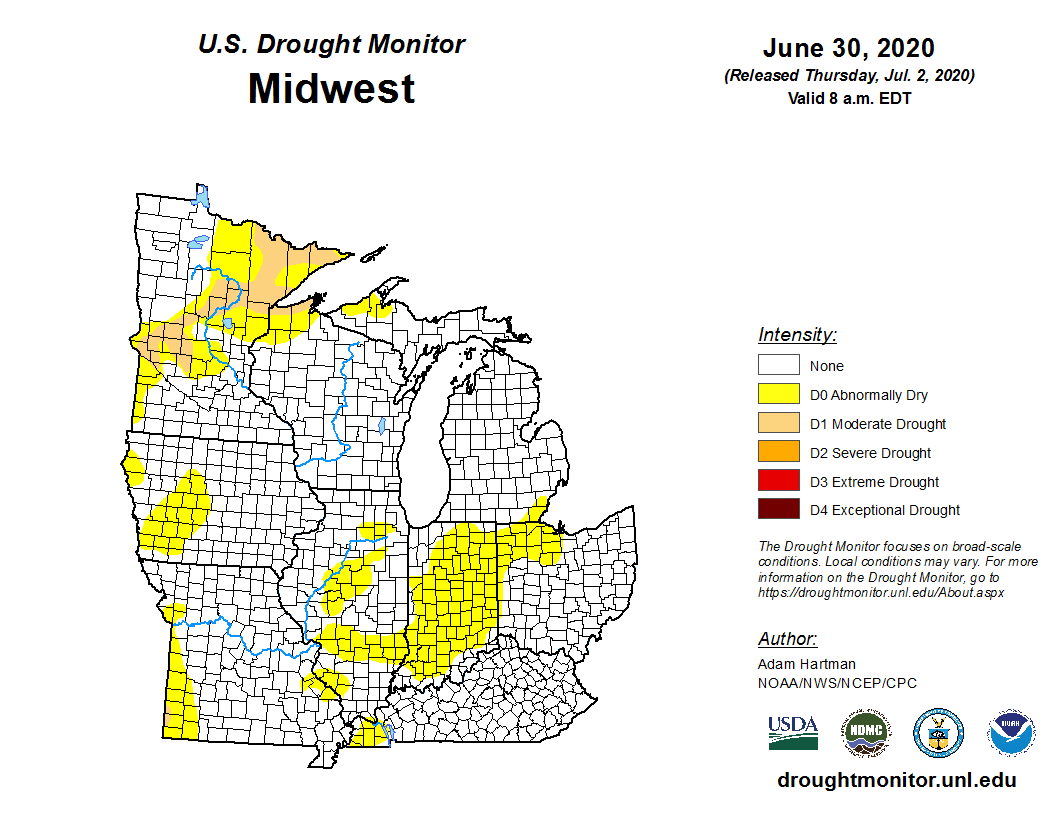
Below normal precipitation and declining soil moisture resulted in the U.S. Drought Monitor identifying abnormally dry (D0) conditions at a number of areas in the state, most notably in south-central and central Illinois. It is important to note that at this time the conditions in these marked areas are considered only abnormally dry and not officially in drought.
Outlooks
Short-term 8- to 14-day outlooks from the Climate Prediction Center show strongly elevated odds of above normal temperatures across the state through the middle of July.
The early to middle part of July is, climatologically, the hottest time of the year in Illinois, and this outlook suggests temperatures will be above the climatological normal. Accordingly, the Climate Prediction Center is indicating a moderate risk of excessive heat over the same period between July 8 and 14 for most of the state.
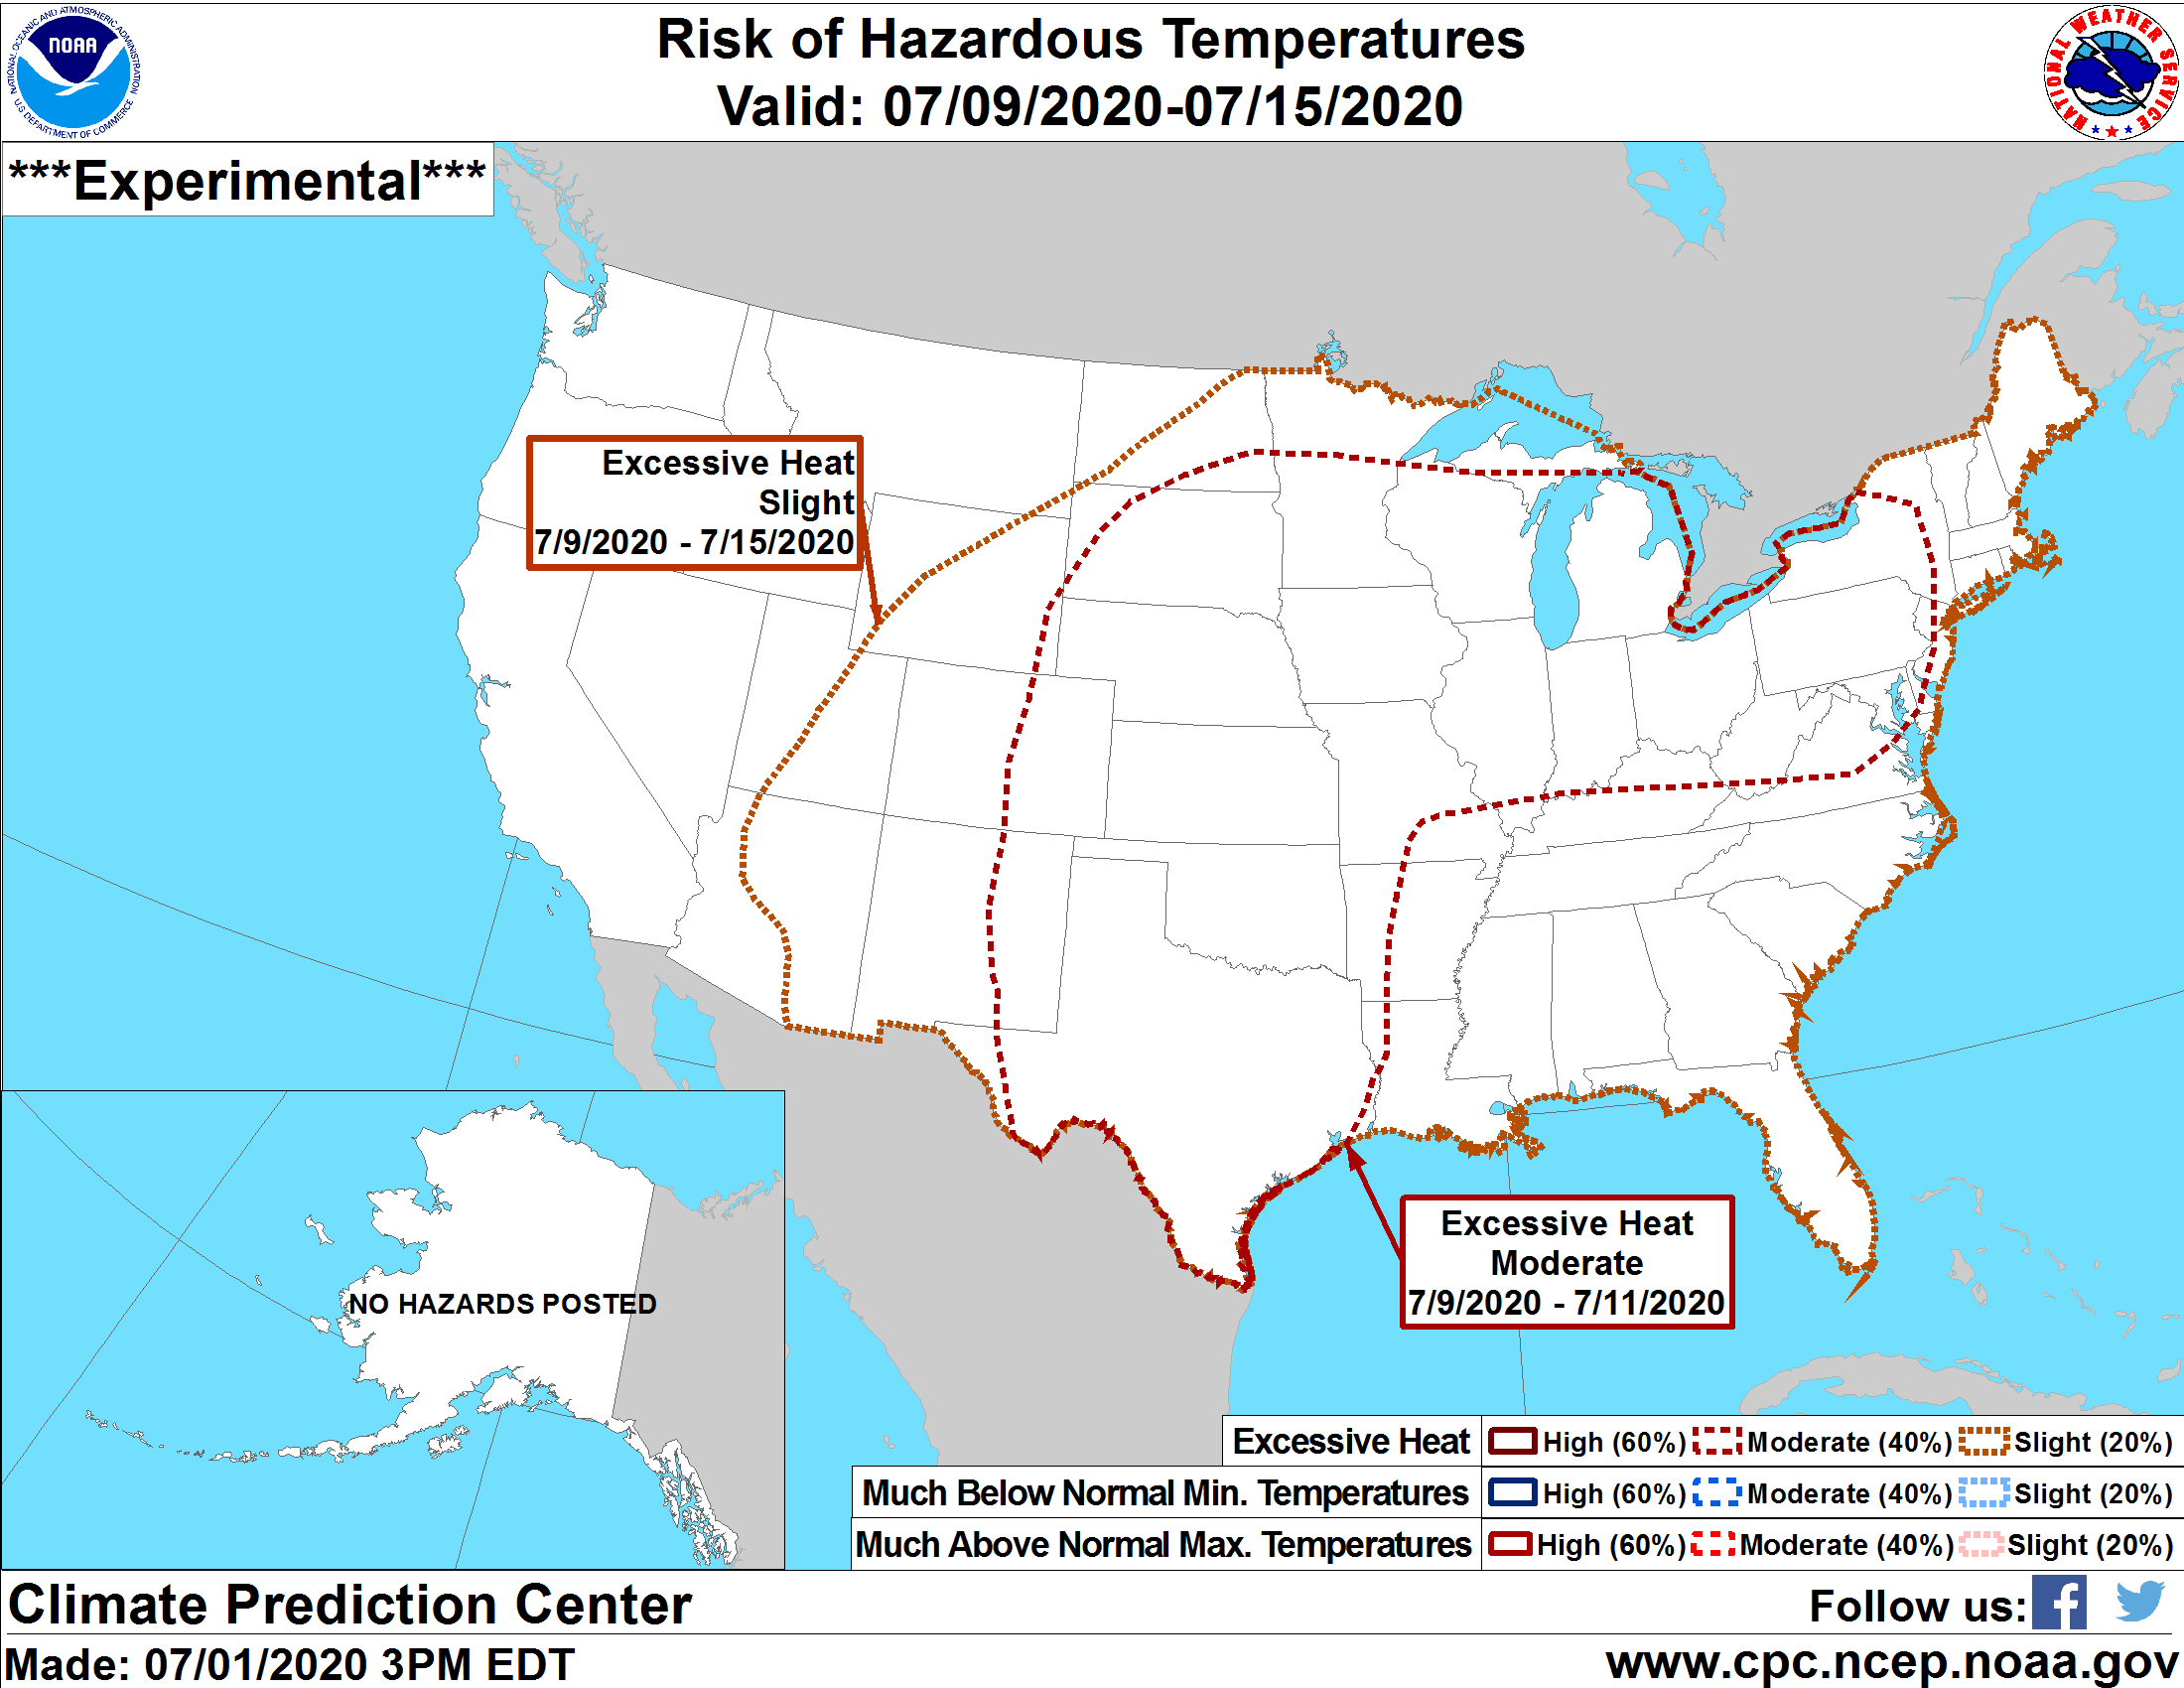
Similar to what we experienced in June, the high temperatures will likely be coupled with very high humidity, resulting in hazardous conditions that increase the risk of adverse human and animal health outcomes.
The precipitation outlook over the same time period indicates slightly elevated odds of drier than normal conditions in Illinois.
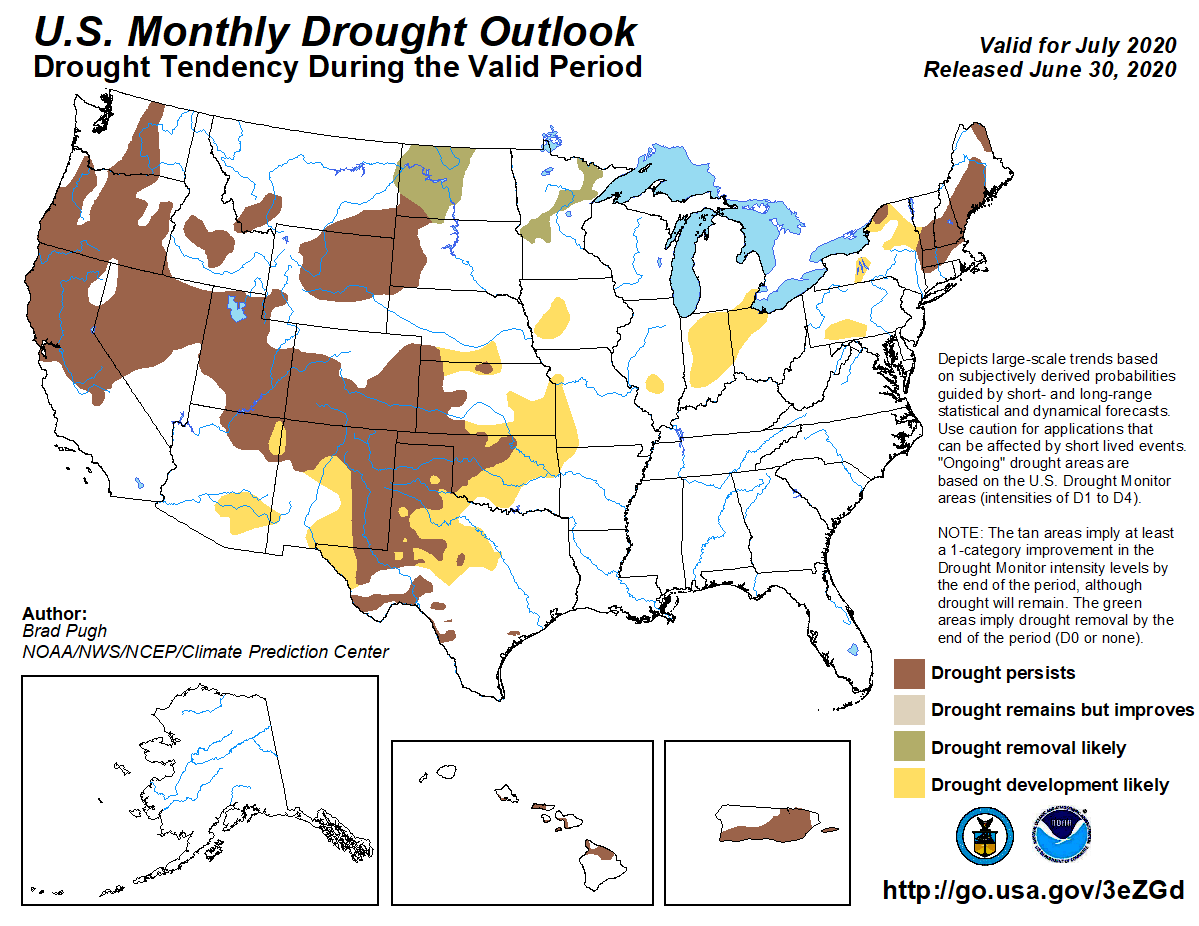
Given that the 8- to 14-day outlooks tilt toward persistence of warm, dry weather to start July, dry conditions in central and south-central Illinois likely will worsen before they are alleviated. The July U.S. Monthly Drought Outlook indicates likely drought development in south-central Illinois in response to expected dry conditions, exacerbated by elevated evaporation due to high temperatures.
Longer-term 30-day outlooks from the Climate Prediction Center show continued elevated odds of warmer than normal conditions through the entirety of July. Precipitation outlooks indicate slightly elevated odds of wetter than normal conditions for July as a whole, hopefully reducing the potential for drought development this month.