

Rainfall
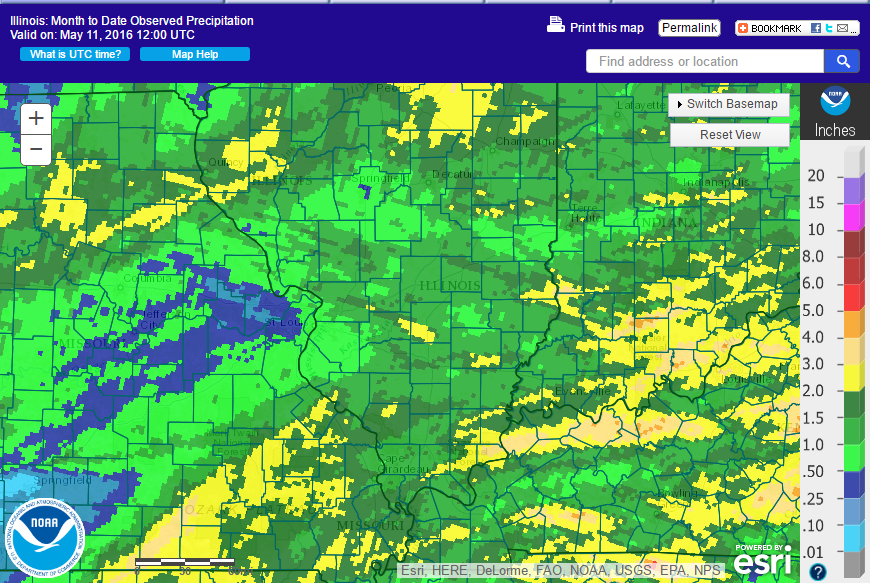
On average, May is the wettest month of the year in Illinois with a statewide normal of 4.62 inches. And so far, this May is living up to that reputation. The two maps below show the rainfall totals through this morning (May 11) for northern and southern Illinois. Rainfall totals were heaviest in the northeast quarter of the state with many areas receiving between 2 and 3 inches or more (shades of yellow and beige). Areas in green are a little lower and range from 0.5 to 2 inches (depending on the shade of green).
The largest reported total for May is Bloomington-Normal (McLean County) with 4.24 inches. The site is located in Normal and yes, Normal is above-normal on rainfall for May. You can find station-level normals for May here.
In addition to the rainfall totals, the frequency is higher than usual as well. On average in Illinois, we can expect rain about 1 out of every 3 days. So far in May this year in Champaign-Urbana, we have had 7 out of 11 days with rain and only brief periods of sunshine. The same is true elsewhere. 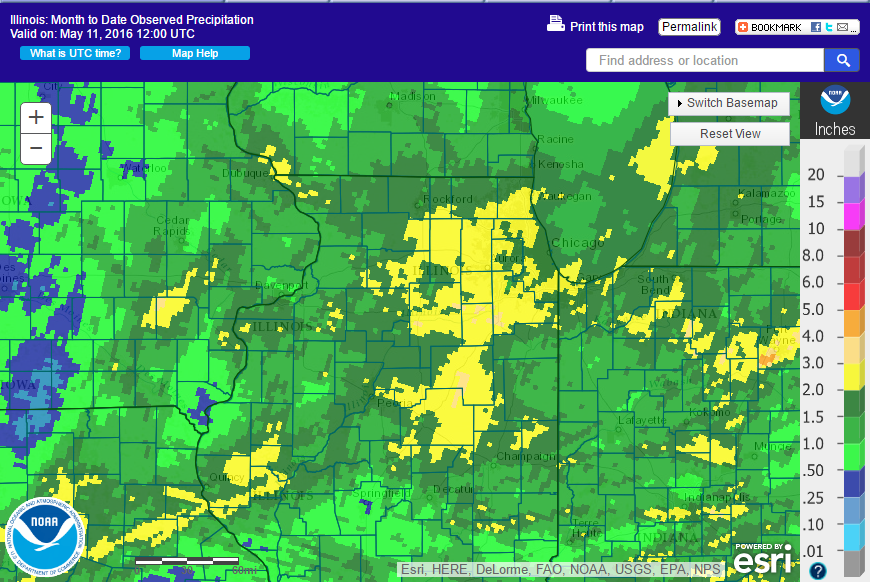
Rainfall Forecast
And the rain keeps coming. Here is the 7-day precipitation forecast from the National Weather Service showing potential amounts of 0.75 to 1.75 inches across northern and central Illinois and potential amounts up to 3 inches or more in southern Illinois. 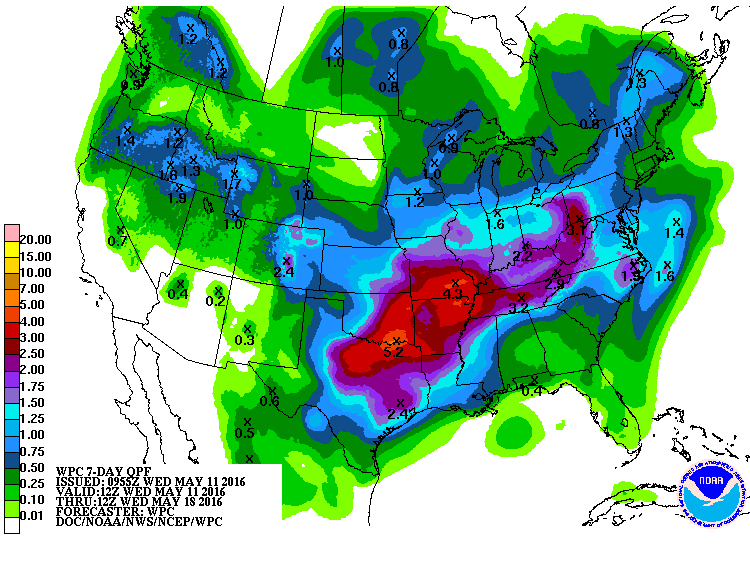
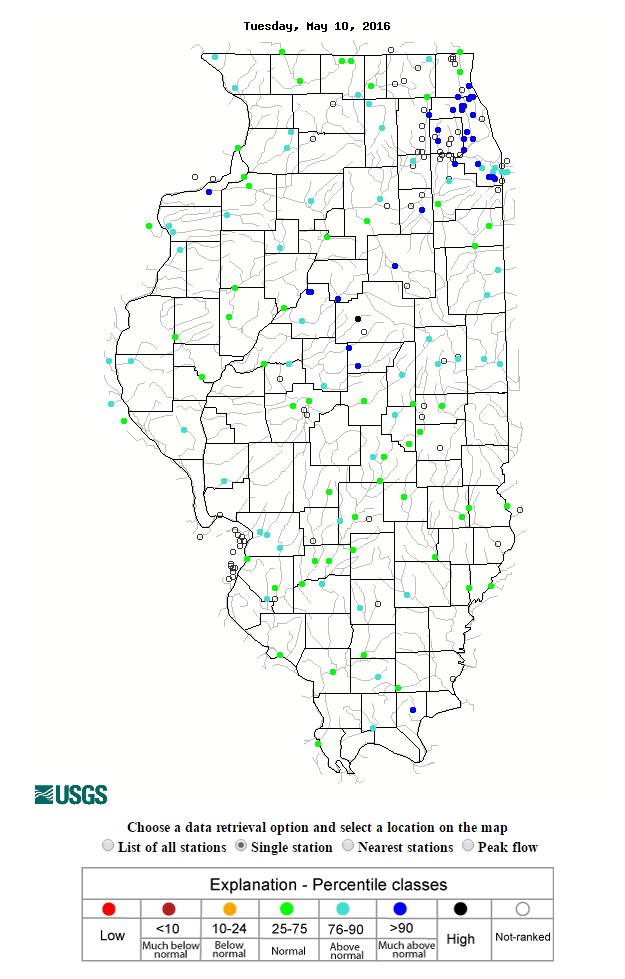
River and Streams
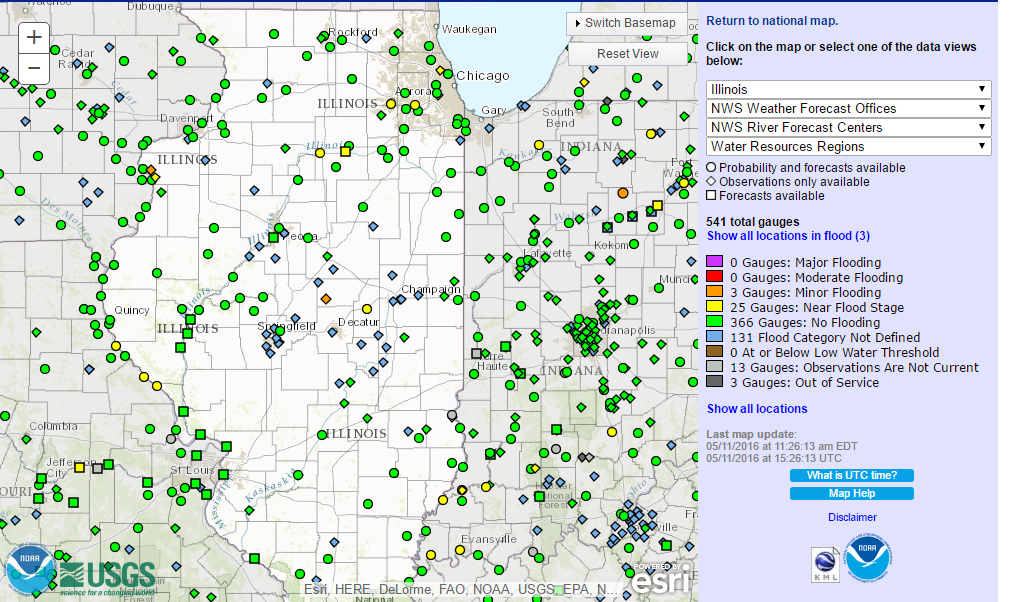
As a result of all the rainfall, rivers and streams are flowing in Illinois, according to NOAA (first map showing flooding) and USGS showing 7-day stream flow (second map).
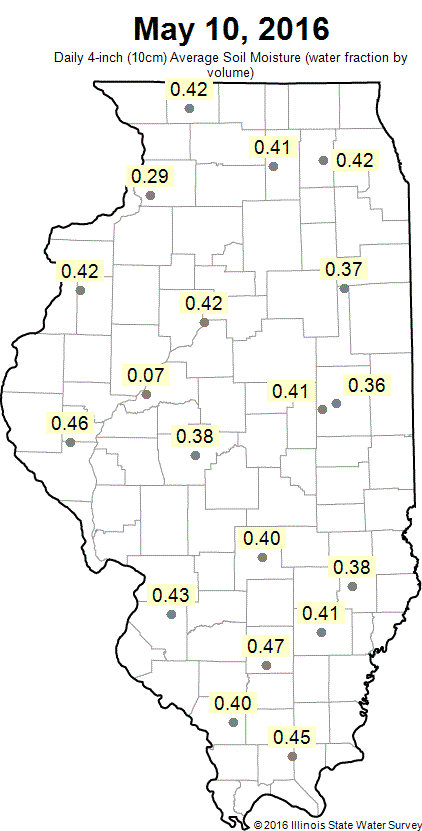
Soil Moisture
As expected, soil moisture is running high across the state. This map of soil moisture from the Water Survey’s network at the 4-inch level. The units are in water fraction by volume so a value of 0.42 means that the soil is 42 percent water at that level. If that sounds like a lot, it is. For most soils in Illinois, anything in the 0.4 range or higher is at or near saturation (meaning all the pore spaces in the soil are filled with water). Values between 0.35 and 0.4 are close to field capacity. The sandy soils near Havana have a much lower water-holding capacity with the one site near Kilbourne at 0.07 water fraction by volume.
In climatology, normal refers to the standard 30-year average of a climate variable that is updated every decade. The current period is 1981-2010. It is a benchmark for comparisons with recent years and with nearby sites.