Cold and Snowy November in Illinois

snow-nov17-2014-smallHere is the scene out my backdoor last night, not just frost on the pumpkin but real snow. And the poor annuals in the flower-pot are done.

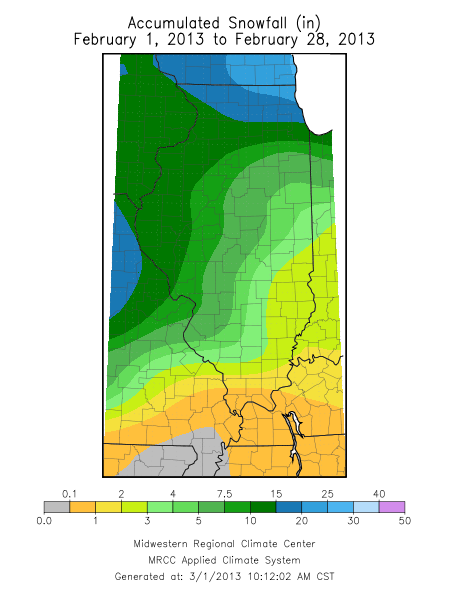
As of this morning we had 0.5 inches of snow in Champaign-Urbana. The snow over this weekend was widespread across Illinois but heaviest in the far north and far south (map below). In fact, the heaviest amounts were in southern and eastern Illinois and included Shawneetown with 4.0 inches, Newton with 3.1 inches, and Beecher City, Paris, and Salem all with 3.0 inches.  Nationally, 50 percent of the US is covered in snow this morning (second map). snow-novThe statewide average temperature for Illinois for November is 37.7 degrees, 6.5 degrees below average. Both Chicago and Rockford have experienced 5 days in a row with temperatures not rising above freezing. And the National Weather Service forecasts for today and Tuesday show that highs will stay in the teens in northern Illinois and in the 20’s in central and southern Illinois. Those are temperatures more typical of January than November. Temperatures are expected to slowly warm up towards the weekend.

nsm_depth_2014111705_National
Fifty percent of the lower 48 states covered in snow.

Champaign-Urbana Winter Weather Stats

Below is a summary of the February and winter weather statistics for Champaign-Urbana:

February

  • The average temperature for February was 19.0 degrees, which was 9.9 degrees below average and the 9th coldest on record.
  • The total snowfall for February was 14.6 inches, which was 8.8 inches above average and the 10th snowiest on record.

Winter

  • The average temperature for the three core winter months of December, January, and February, was 21.6 degrees, which was 8.6 degrees below average and the 9th coldest on average.
  • Our seasonal snowfall total that goes all the way back to November, was 41.1 inches as of March 3. That makes it the 7th snowiest seasonal total on record and 17.9 inches above the seasonal average of 23.2 inches.

It was certainly a cold and snowy winter but it was hard to beat those winters in the late 1970s and early 1980s. For example, the winter of 1977-78 experienced the most snow in Champaign-Urbana history with 67.2 inches. It was also the coldest during the December-February period at 20.2 degrees.

The official NWS cooperative observer site is located at the Illinois State Water Survey near the corner of First and Windsor in Champaign.

Winter Finally Arrives in Illinois In February

February

The preliminary numbers are in and winter finally arrived in February. The statewide temperature for February finished at 29.3 degrees, which was 1.5 degrees below average. The statewide precipitation was 2.7 inches, which was 0.6 inches above average. The precipitation total represented both rainfall and the water content of any snow. Snowfall for February ranged from less than an inch in southern Illinois to over 20 inches in the far northeast corner of the state.

Winter

For the core winter months of December, January, and February, the statewide temperature was 31.8 degrees, which was 2.8 degrees above average. The statewide average precipitation was 9.1 inches, 2.2 inches above average. It was the 11th wettest winter on record for Illinois. Snowfall for those three months ranged from less than 10 inches in east-central Illinois to over 20 inches in parts of far western and northern Illinois, as well as in a band across southern Illinois.

Maps

Here are the maps of precipitation and snowfall for February.

February 2013 Precipitation.

February 2013 Precipitation Departures From Average.

February 2013 Snowfall.

February 2013 Snowfall Departure.

The Tale of Two Winters – One Dry, One Wet

We have had a remarkable contrast in the last two winters in terms of precipitation. While both winters have been relatively quiet in terms of snow (at least up until the last week), this winter has made up for it in rainfall.
Here are the January 1 to February 25 precipitation departure maps for 2012 (first figure) and 2013 (second figure) for the Midwest. Precipitation is the combination of rainfall and the water content of any snow/sleet/freezing rain events.
Areas in shades of yellow show below-average precipitation while areas in shades of green show above-average precipitation. As you can see, the widespread yellow in 2012 was replaced with widespread green in 2013. This is good news for Illinois and for the Midwest.
First two months of 2012.
First two months of 2013.