The preliminary numbers are in and the statewide precipitation was 3.9 inches, 1.9 inches above average. Most of the state was in the 3 to 6 inch range except for some drier areas in central and western Illinois. It was wettest in southeastern Illinois with several sites with over 6 inches, including Smithland Lock and Dam on the Ohio River with 9.7 inches. By the way, the precipitation amount includes both rain events and the water equivalent of any snow.
Snowfall for January was below average and ranged from 6.5 inches in the northwest corner to zero in far southern Illinois (second map).
Even though January finished with below-average snowfall, it was offset with above-average rainfall in many areas. The impact of these rains were discussed in an earlier post. As a result, the U.S. Drought Monitor has reduced the area in drought or abnormally dry conditions since January 1 (last figure) by 11 percent.
The statewide temperature for January was 28.7 degrees, four degrees above average. It was far short of the warmest January on record that was established in 2006 with 37.9 degrees and followed closely by 1933 with 37.7 degrees.


End of the Snow Drought in Illinois
With the looming winter storm expected to reach Illinois on Wednesday and Thursday, we should see the end of the 2012 snow drought in Illinois. Last winter’s snowfall season was cut short by warm and dry conditions in February and March. Meanwhile, the start of this winter’s snowfall was much delayed by the warm, dry conditions of the past several weeks. As a result, many sites in northern and central Illinois approached or set their records for the longest snow-free period.
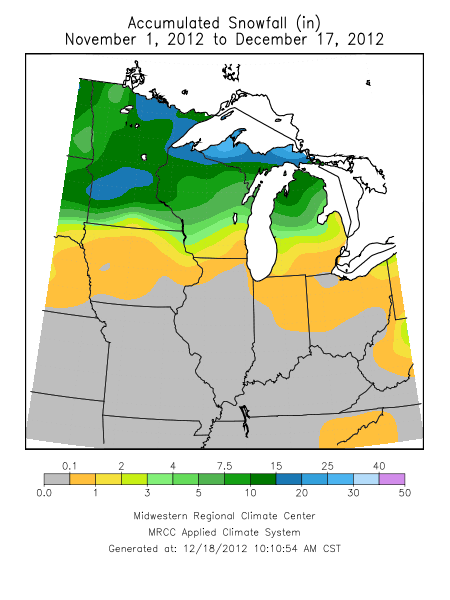
Here is the map of total snowfall for this winter through December 17, how much we normally get through December 17, followed by reports on the remarkable snow-free season in Illinois. A few sites in western Illinois reported snowfall this morning.


Here is the report for Chicago. Here are additional reports for central Illinois and northwest Illinois.
PUBLIC INFORMATION STATEMENT
NATIONAL WEATHER SERVICE CHICAGO IL
1153 AM CST MON DEC 17 2012 /1253 PM EST MON DEC 17 2012/
...LATEST ON SNOWFALL RECORDS...
SUNDAY DECEMBER 16TH MARKED THE 287TH CONSECUTIVE DAY WITHOUT
MEASURABLE SNOWFALL AT ROCKFORD...BREAKING THE PREVIOUS
CONSECUTIVE DAY RECORD THAT HAD BEEN SET IN 1922. THIS IS NOW THE
LONGEST PERIOD OF TIME WITHOUT MEASURABLE SNOWFALL IN ROCKFORD ON
RECORD. THE LAST DAY WITH MEASURABLE SNOWFALL WAS MARCH 4TH.
CHICAGO HAS ALREADY BROKEN THEIR RECORD.
ROCKFORD
RANK # DAYS DATES W/O MEASURABLE SNOW
 1) 287 03/05/2012-12/16/2012+
 2) 286 03/03/1922-12/13/1922
 3) 284 02/26/1908-12/05/1908
 4) 282 03/31/1939-01/06/1940
 5) 270 03/06/2011-11/30/2011
 270 03/10/1999-12/04/1999
CHICAGO
RANK # DAYS DATES W/O MEASURABLE SNOW
 1) 287 03/05/2012-12/16/2012+
 2) 280 03/01/1994-12/05/1994
 3) 277 03/10/1946-12/11/1946
 4) 269 03/11/1999-12/04/1999
ON AVERAGE...CHICAGO HAS 226 DAYS IN A ROW WITHOUT MEASURABLE
SNOWFALL /SEVEN AND A HALF MONTHS/ AND ROCKFORD HAS 233 /ALMOST
EIGHT MONTHS/.
GIVEN THE CURRENT FORECAST...IT APPEARS BOTH LOCATIONS COULD HAVE
THEIR RECORD SNOW DROUGHT PERIODS COME TO AN END ON WEDNESDAY NIGHT
OR THURSDAY...WITH EVEN THE POSSIBILITY OF A BRIEF SNOW EARLIER ON
TUESDAY MORNING.
HERE ARE SOME STATISTICS REGARDING FIRST/LAST MEASURABLE SNOWFALLS...
CHICAGO ROCKFORD
 EARLIEST: 10/12/2006 10/12/1909
1ST AVERAGE: NOV 16 NOV 20
 LATEST ??/??/2012 01/07/1940
EARLIEST: 02/27/1997 02/06/1911
LAST AVERAGE: APR 4 APR 1
 LATEST 05/11/1966 05/11/1966
HERE ARE THE LATEST FIRST MEASURABLE SNOWFALLS FOR CHICAGO AND
ROCKFORD...
CHICAGO ROCKFORD
1) ??/??/2012 1) 01/07/1940
2) 12/16/1965 2) 12/21/1996
3) 12/14/2001 3) 12/19/2001
4) 12/12/1946 12/19/1948
5) 12/10/2003 5) ??/??/2012
6) 12/09/2011 6) 12/14/1922
 12/09/1948 7) 12/12/1916
8) 12/07/1914 8) 12/11/1924
9) 12/06/1994 9) 12/10/1970
10) 12/05/1999 12/10/1932
 12/05/1984 11) 12/08/1956
 12/05/1973 12/08/1927
 12/05/1909 12/08/1914
$$
MTF/RODRIGUEZ
Latest Outlook for this Winter in Illinois
The NWS Climate Prediction Center posted their latest outlook for December and December – February (winter). The temperature outlook for December is for equal chances (EC) for above, below, and near-normal temperatures. The precipitation outlook for December is a little more interesting with an increased chance of above normal precipitation in the southern half of Illinois. The rest of the state is in the EC category.
There is not much to report on the December-February outlook for Illinois with the state in EC for both temperature and precipitation, except for an increased chance of above-normal precipitation in far southern Illinois.
Part of the reason for the bland outlooks is that the Climate Prediction Center expects near-normal temperatures in the eastern Pacific Ocean along the equator. That means there is no El Niño or La Niña expected for this winter.
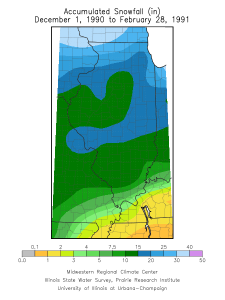
I looked at three winters that had a similar setup in the Pacific Ocean (slightly raised sea-surface temperatures but not a full-blown El Niño event). They are the winters of 1979-80, 1990-91, and 2003-04. In Illinois, each of these winter were slightly warmer than normal – on average by half a degree. Two out of the three had below-average precipitation (1979-80 was 2.2 inches short, 2003-04 was 1.3 inches short, while 1990-91 was 1.4 inches above). All three had below-average snowfall in the north. However, two out of three had above-average snowfall in southern Illinois (1979-80 and 1990-91). See the maps below for more details on snowfall.


Record Setting March
March Temperature
The statewide average temperature for March in Illinois was 54.9 degrees, 13.8 degrees above normal. That makes it the warmest March on record. So here are the ten warmest March’s in the Illinois statewide records that date back to 1895:
- 2012: 54.9°F
- 1946: 51.6°F
- 1910: 50.9°F
- 1945: 50.5°F
- 1921: 49.1°F
- 1938: 48.1°F
- 2007: 47.6°F
- 1973: 47.5°F
- 1907: 47.0°F
- 1918: 46.4°F
The warmest temperature report in the state was Chicago O’Hare on March 21 with 87 degrees. The coldest temperature report was Monmouth on March 5 with 5 degrees.
January-March Temperature
The statewide average temperature for January-March in Illinois was 40.9 degrees, 9.1 degrees above normal. That makes it the warmest January-March on record. Here you will notice that the 2000s are on the list three times as are the 1990s.
- 2012: 40.9°F
- 1921: 39.2°F
- 1990: 38.7°F
- 1946: 38.1°F
- 1938: 37.6°F
- 1998: 37.3°F
- 1992: 36.9°F
- 2006: 36.7°F
- 2000: 36.7°F
- 1973: 35.9°F
March Precipitation
The statewide average precipitation was 2.11 inches, 1.1 inches below normal or 66 percent of normal. The statistics are nothing like the March temperatures, but it did end up being the 31st driest March on record for Illinois. Precipitation was below normal across much of the state. However, there were a few wet spots with Fairview Heights (IL-SC-16) reporting the highest monthly total of 4.88 inches of precipitation. Here are the maps of accumulated precipitation and the departure from normal for March in Illinois.


March Snow
With all the attention on the record warmth, it’s hard to remember that we did see snow in March. The largest monthly total was reported at Roscoe (IL-WN-2) with 5.6 inches of snow.


