December temperatures were well above the long-term average across the state, breaking dozens of local daily maximum and minimum temperature records. The preliminary statewide December average temperature was 35.2 degrees, about 5 degrees above the 1981-2010 normal and the 18th warmest on record. Preliminary data show December was drier than average for most of the state. The statewide average December precipitation total was 2.03 inches, 0.66 inches below the 30-year normal.
Data are provisional and may change slightly over time
Warm Weather
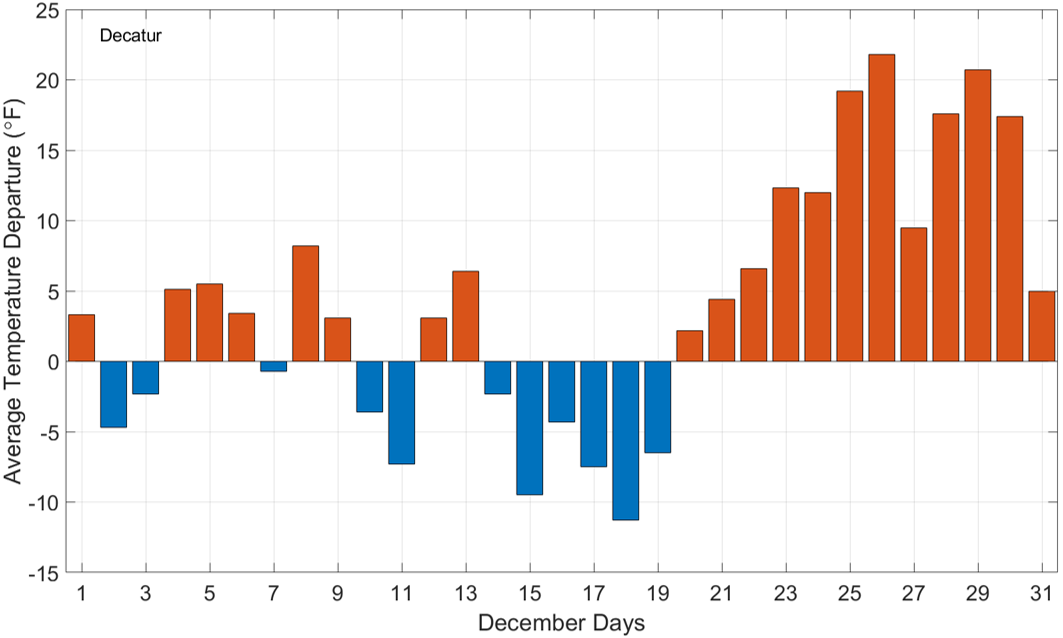
Temperatures during the first half of December were very close to average. This was followed by a brief period of well below average temperatures caused by cold air incursion from the north on the back of a strong upper atmosphere trough to our west. On December 20 the predominant wind direction changed to southwesterly, bringing warm, dry air into the region. Temperatures between December 20 and 29 ranged from 5 to 25 degrees above normal across the state. In total, 104 daily high maximum temperature records and 27 daily high minimum temperature records were broken over this time period, including a few dozen records on December 25. In fact, it was the warmest Christmas day at 68 stations across the state. As shown in the figure below, the daily average temperature in Decatur in Macon County on Christmas was nearly 20 degrees above the 30-year normal.
The station in Elgin (Kane County) broke its previous Christmas day high maximum record by 10 degrees. The highest temperature recorded in the state was 70 degrees on December 26 in Wayne County and again on December 29 in Pope County. The lowest temperature was -4 degrees on December 15 in Rock Island County.
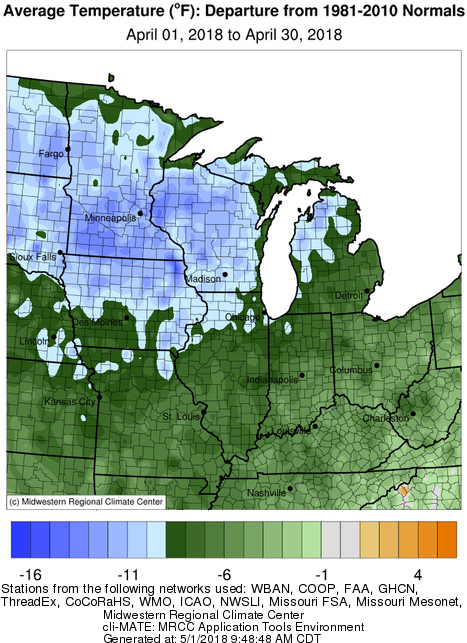
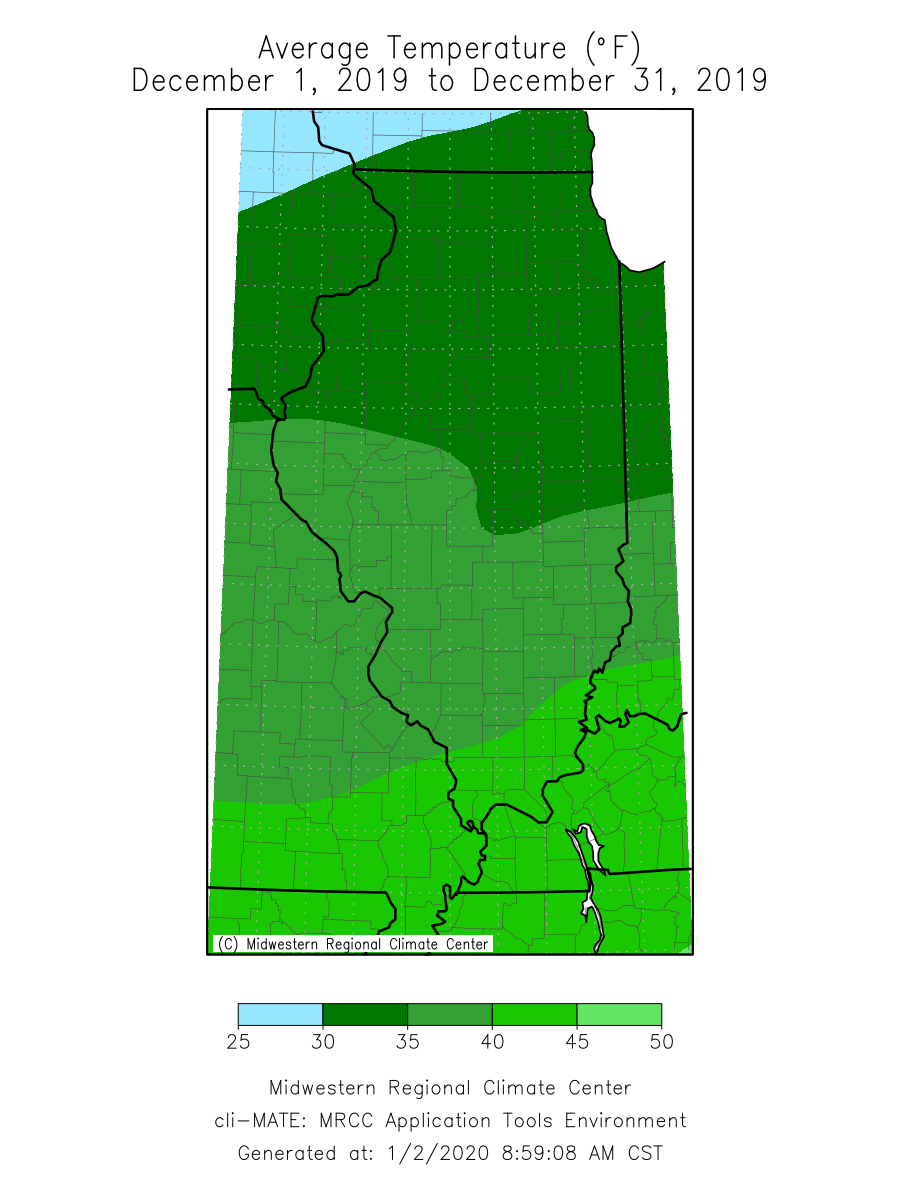
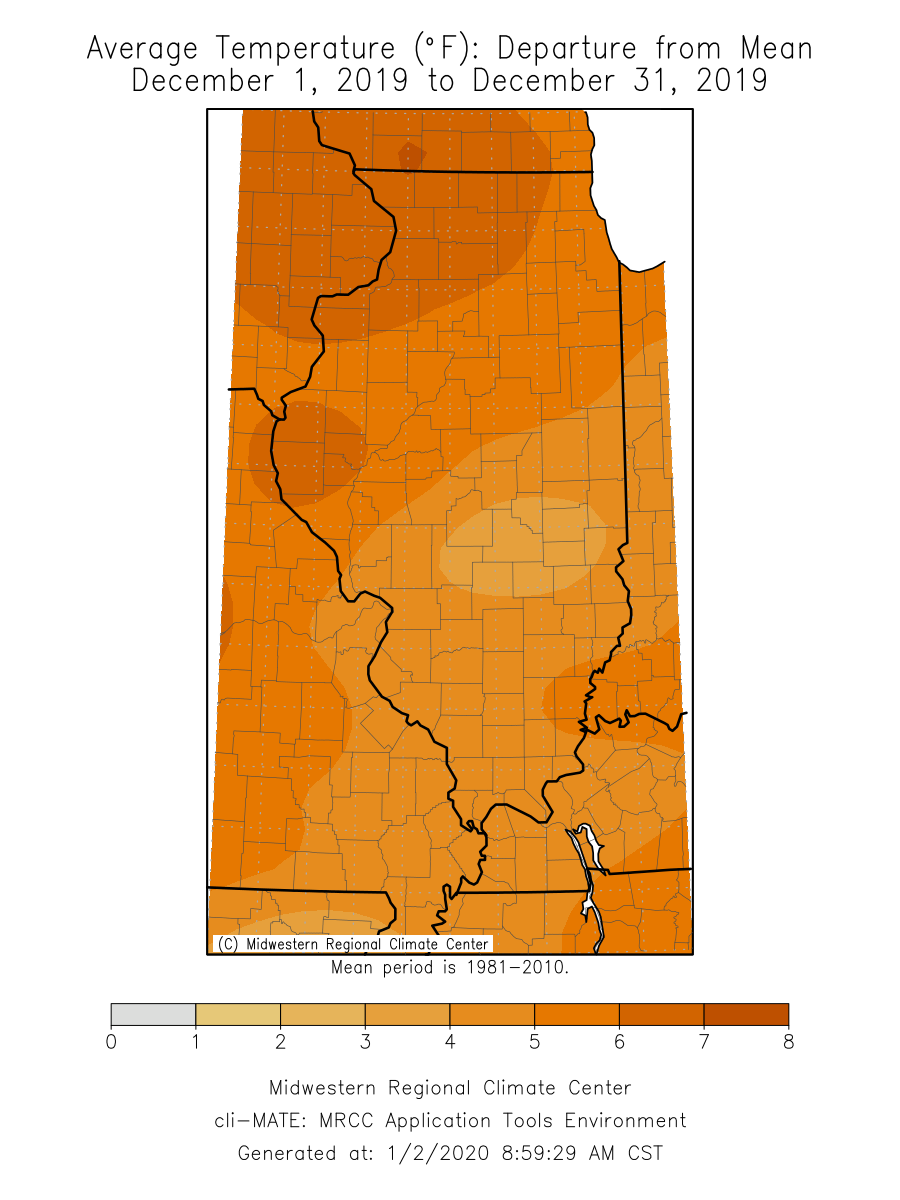
A shift in the upper atmosphere and the passage of a cold front late in the month allowed temperatures to moderate. December average temperatures ranged from the low 30s in northern Illinois to the mid-40s in southern Illinois. Monthly average temperature departures ranged from 7 degrees above the long-term mean in northwestern Illinois to just over 1 degree above average in south-central Illinois.
The preliminary 2019 statewide average December temperature was 35.2 degrees, which was the 18th warmest December on record. December’s warm weather was an aberration in an otherwise colder than average 2019 in Illinois. Only three months this year–July, September, and December–exhibited a statewide average temperature above the 30-year normal.
Precipitation
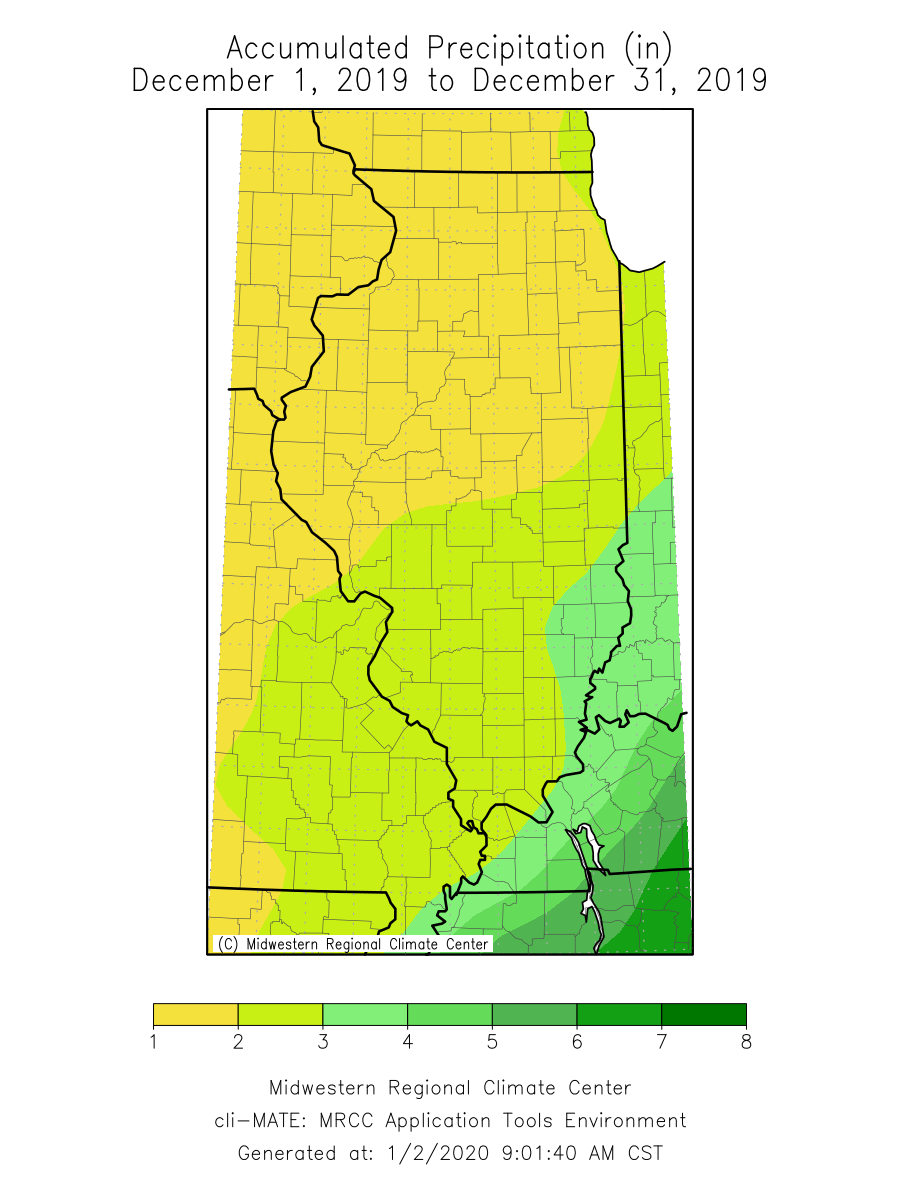
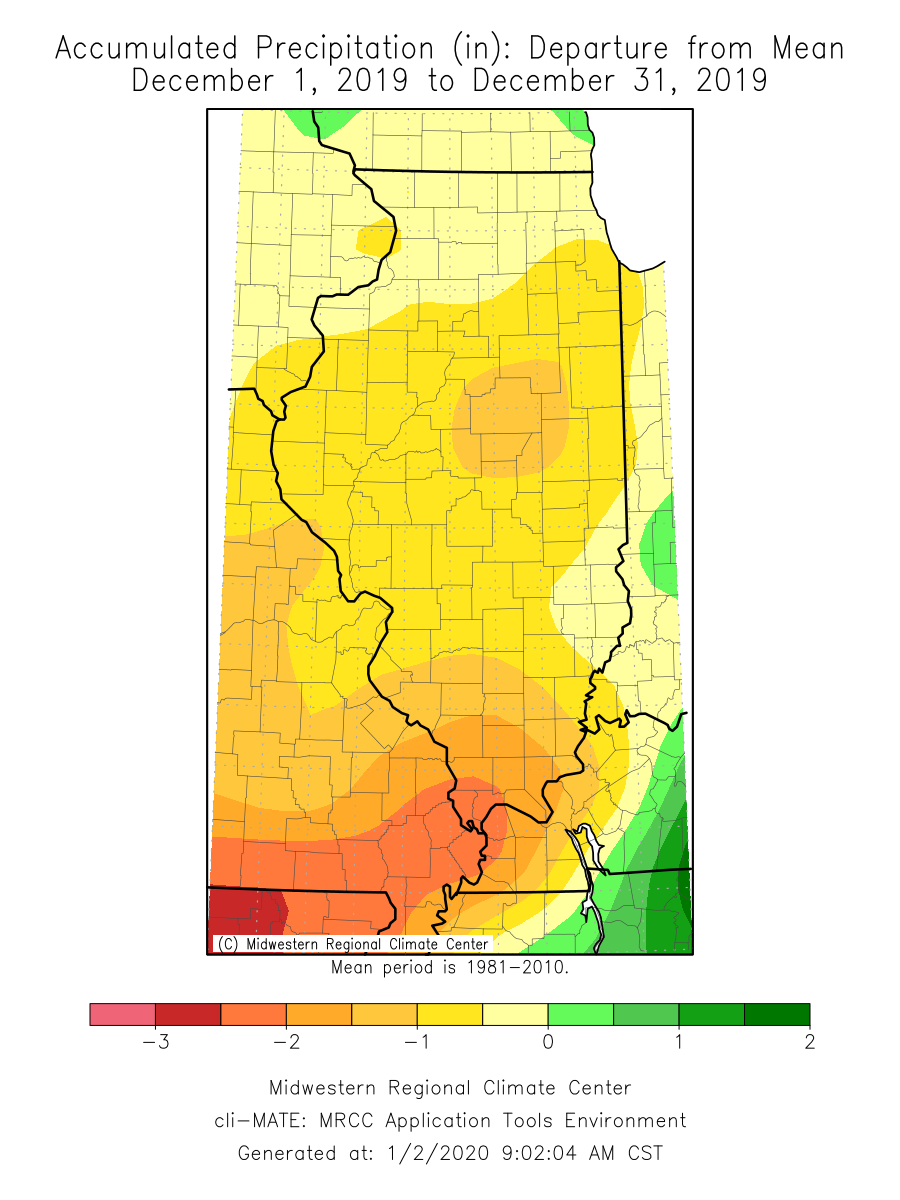
December precipitation was below the long-term average for the entire state. Areas in far southern Illinois received 2 to 3 inches less than average in December, approximately 50 percent of normal December precipitation. The statewide average total December precipitation was 2.03 inches, approximately 0.66 inches below normal. This last month was the 50th driest December on record in Illinois and marked the second straight month of below average statewide precipitation. Preexisting wetness and reduced evaporative demand, typical for this time of the year, have prevented impacts from the prolonged dry conditions. Despite two straight months of well below average precipitation, streamflow and soil moisture were both near normal across the state.
Snowfall totals this last month ranged from less than a tenth of an inch in far southern Illinois to over 10 inches in south-central Illinois. A strong system came through in mid-December and brought several inches of snow to an area spanning the St. Louis Metro East to the Champaign-Urbana area. The highest 24-hour snowfall total was 5.6 inches in Lovington (Moultrie County) on December 17, although CoCoRaHS observers in Mascoutah in St. Clair County and Columbia in Monroe County both recorded 7.5 inches on December 17.
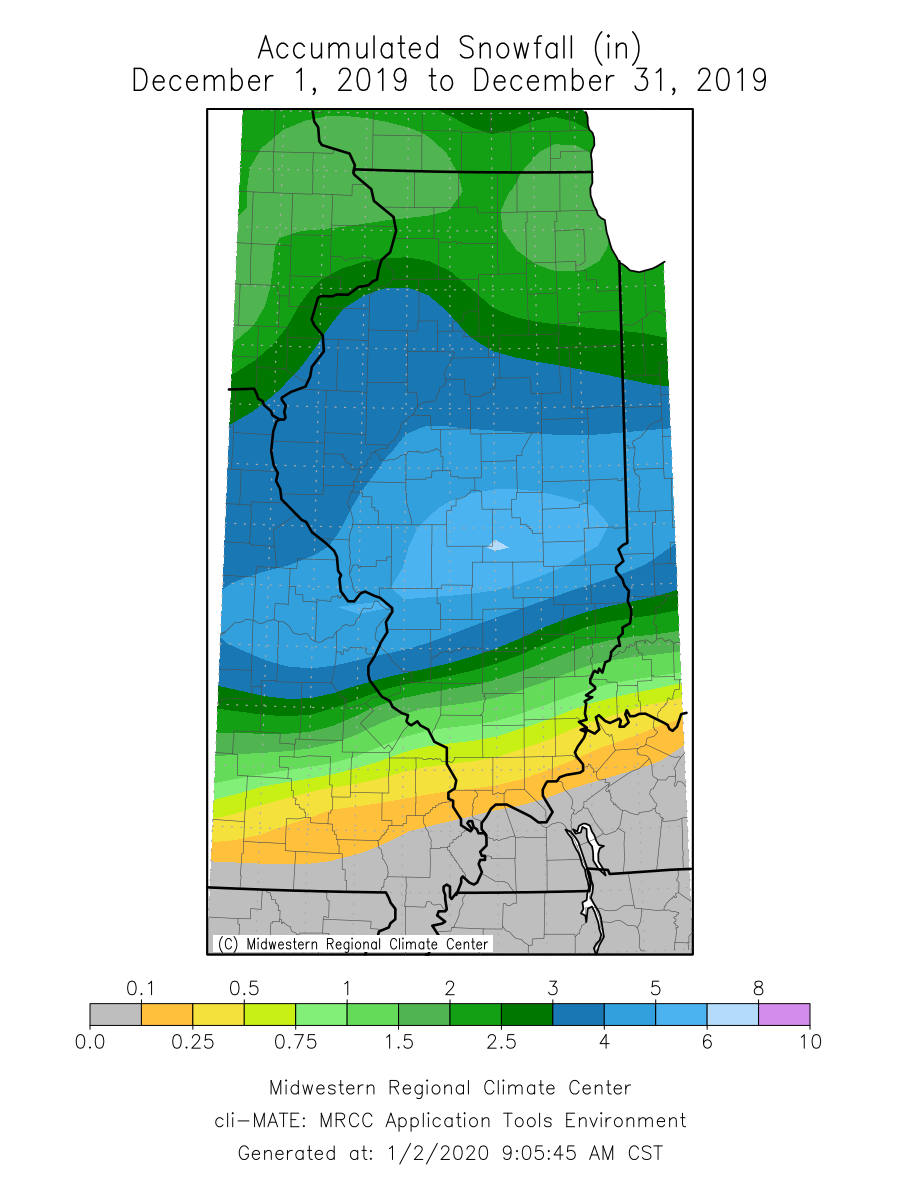
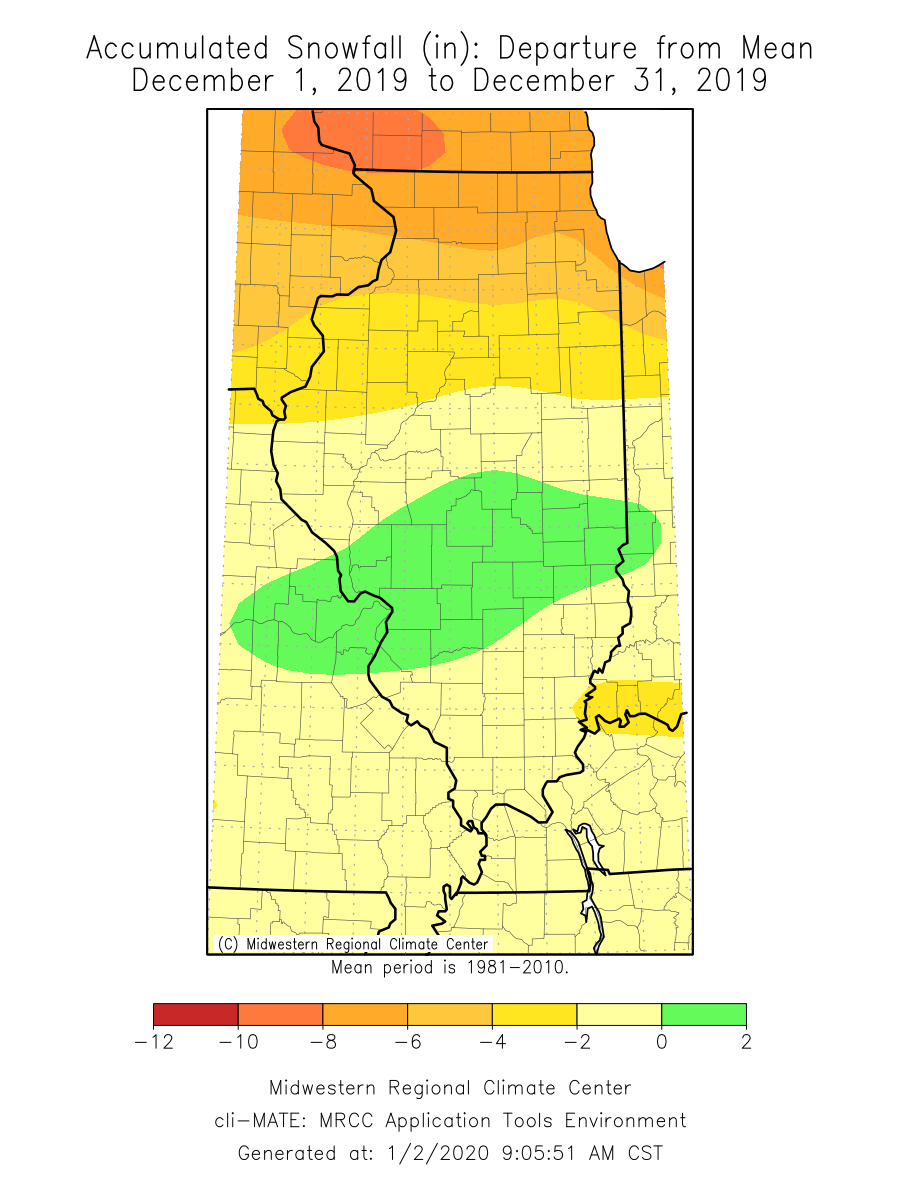
The December snowfall glut in south-central Illinois turned into snowfall deficits of 8 to 10 inches in northern Illinois. This last month was only the 10th December with 1 inch or less of snowfall in Stockton (Jo Daviess County). Despite the small snowfall totals this last month, the seasonal total snowfall was above average for most of the state between interstates 80 and 64. A broad area between Peoria and the St. Louis metro east received over 4 inches of above average snowfall, whereas the Chicagoland region has so far this season experienced a snowfall deficit of 4 to 6 inches.
Outlooks
Short-term 8-14-day outlooks from the NOAA Climate Prediction Center show strongly elevated odds of both above normal precipitation and above normal temperature.
Thirty-day outlooks show elevated odds of wetter and warmer than normal conditions to persist throughout January in southern Illinois. Outlooks for January through March and March through May continue to show elevated odds of above normal precipitation for the entire state.