Illinois in 2012 – Second Warmest and Tenth Driest on Record

2012 Summary

The year 2012 will long be remembered for the drought and the exceptionally warm temperatures. While the data for December is still preliminary, it was the second warmest and tenth driest year on record for Illinois.
The statewide average temperature for 2012 was 55.5 degrees, 3.3 degrees above normal and the second warmest year on record for Illinois. The warmest year was 1921 with 55.6 degrees. Temperatures were much warmer than normal in January-May, July, and December (figure below). For some places in Illinois it was the warmest year on record, including Chicago and Rockford (see story here).
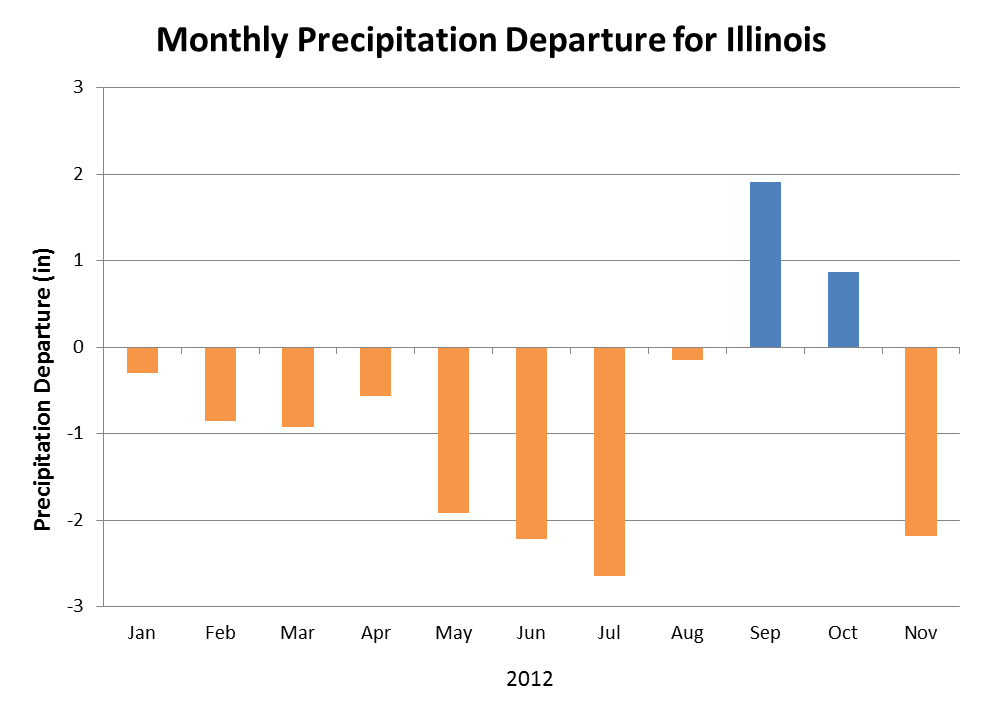
The statewide average precipitation for 2012 was 30.37 inches. That was 9.83 inches below normal and the 10th driest year on record in Illinois. The normal annual precipitation in Illinois is 40.20 inches.  Precipitation was much drier than normal in May-July and November (figure below). Here is how 2012 compared with other dry years:

  1. 1901 – 26.34″
  2. 1930 – 27.88″
  3. 1963 – 28.00″
  4. 1953 – 28.05″
  5. 1914 – 28.58″
  6. 1976 – 28.84
  7. 1940 – 29.33″
  8. 1988 – 29.71″
  9. 1936 – 30.24″
  10. 2012 – 30.37″

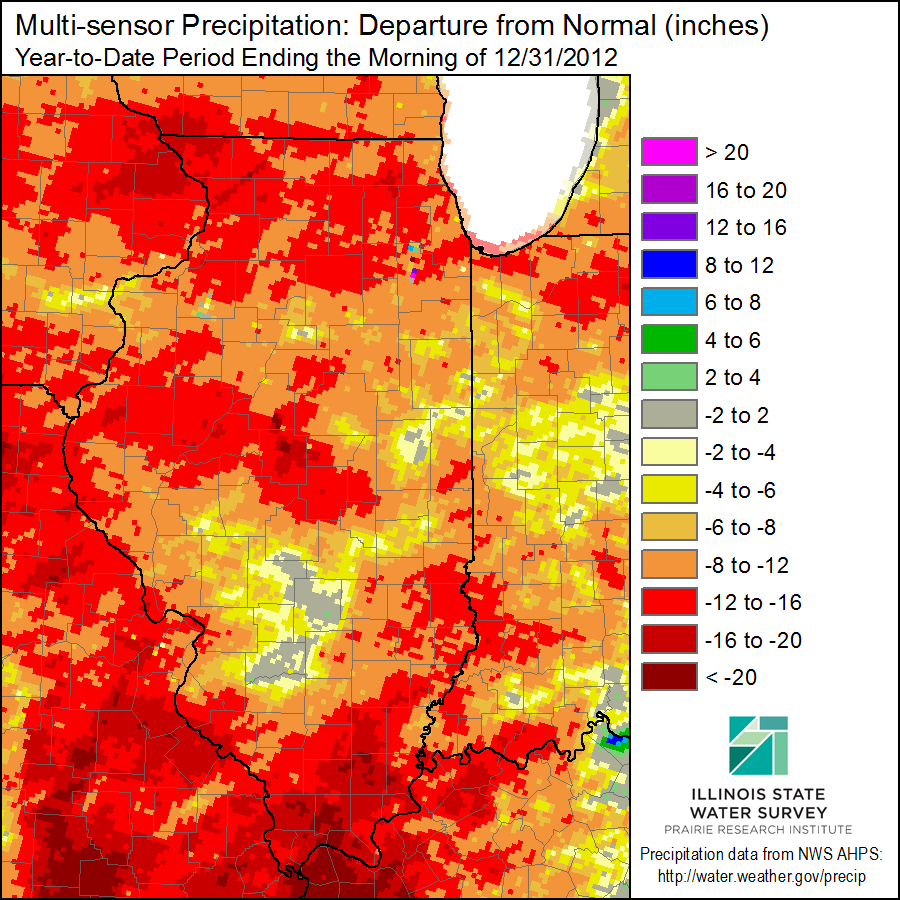
The map of the precipitation departures from normal across the state (below), as of December 31, 2012, shows large areas of the state with deficits in the range of 8 to 16 inches below normal (the darker tan and bright red colors) for 2012.
Unfortunately, winter is our driest time of year in Illinois.  The normal precipitation for January and February is 2.11 and 2.12 inches, respectively. Even March is not much wetter at 2.98 inches. That adds up to 7.21 inches for those three months combined. It would take something close to record precipitation in January (6.92 inches), February (4.46 inches), and March (7.53 inches), for a total of 18.91 inches, to erase the deficits accumulated in 2012.

December 2012

The statewide average precipitation for December 2012 was 2.34 inches, just 0.4 inches below normal.
The statewide average temperature for December 2012 was 35.8 degrees, 5.9 degrees above normal and the  13th warmest December on record. The warmest December on record was 1923 with 39.7 degrees.

Figures

image003
image008
Click to enlarge.

Chances of a White Christmas

What are the chances of a White Christmas (defined as at least an inch of snow on the ground on Christmas Day)? The National Climatic Data Center has updated their US map to show the current 1981-2010 averaging period. The odds are high in the Rocky Mountains, the upper Midwest, and the Northeast. However, a White Christmas is rarely, if ever, seen in much of the southern half of the US or along the West Coast.
We did a similar map with more detail for Illinois last year (second map).  It should come as no surprise that the highest odds are in northern Illinois.  In general, the odds are about 40-60 percent in the northern third of Illinois, 20-40 percent in central Illinois, and 0-20 percent in southern Illinois.
There can be large differences from site to site. Snowfall is notoriously difficult to measures with two nearby sites having different results due to exposure to sun and wind.

Chances of a White Christmas across the US. National Climatic Data Center (NOAA).

odds of a white Christmas
The odds of a white Christmas in Illinois, based on 1981-2010 data. Click to enlarge.

2nd Warmest January to November on Record for Illinois

The statewide average temperature in Illinois for January to November this year was 57.3 degrees, based on preliminary data. That is 3.1 degrees above normal and the second warmest on record back to 1895. Only 1921 was warmer with 57.6 degrees. This was in spite of a fall where the statewide average temperature was 52.7 degrees and 1.5 degrees below normal. Most of the above-normal warmth occurred in the January to July time frame. See graph below.
As mentioned earlier, the statewide average precipitation in Illinois for January to November this year was 27.6 inches and the 12th driest on record. This was in spite of a fall where the statewide average precipitation was 10.13 inches, 0.16 inches above normal. The graph below illustrates the beginning of a drought recovery in September and October before the dry November.

Statewide average temperature for Illinois as a departure from the 1981-2010 normal.
Statewide average temperature in Illinois for 2012 as a departure from the 1981-2010 normal.

Statewide.
Statewide average precipitation in Illinois for 2012.

First Snow in Illinois


The other night we had a brief period of snow with no accumulation on the ground here in Champaign. However I did see some on my car for a few minutes (see right) before it melted. That reminded me that Zoe and I had worked on some “first snowfall” maps. These maps are based on sites that reported snowfall regularly since 1981. The dates are the earliest and median dates of the first measurable snow (0.1 inches or more) for the standard averaging period of 1981 to 2010 (also known as “normal”).
No real surprises for anyone who has experienced winter in Illinois. The earliest dates are in the late October, early November time frame. And the median dates range from late November in northern Illinois to the second half of December in southern Illinois. Even so, the dates can vary considerably between nearby sites since many of the early season snows are sporadic and not very widespread.
The median is also known as the 50th percentile and represents in the “middle” of the distribution of dates. In many cases it is a better measure than the average, which can be thrown off by some date that is extraordinarily early or late.

Earliest measurable snow in Illinois for the period from 1981 to 2010. Click to enlarge.

Median date of the first measurable snowfall in Illinois for the period from 1981 to 2010. Click to enlarge.