Frost Depth in Illinois

One of the effects of this exceptionally cold winter has been that our soils have remained frozen at considerable depths. We have hourly soil temperatures under grass at 19 sites across the state at 4 and 8 inches, available through the WARM website, that give us glimpses of soil conditions.

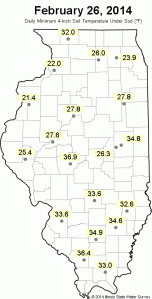
Here are snapshots of the daily low soil temperature at 4 inches yesterday and a week ago when temperatures were much warmer. The 4-inch temperature responded to the warmer weather and showed signs of thawing before re-freezing this week. In many parts of the state, the 8-inch soil temperatures remained frozen during this period. Click on each map to enlarge.

feb21          feb26

Soil temperatures depend on soil types, soil moisture, vegetation, snowcover, and exposure. In general, drier soils warm up and cool faster than wet soils. Both vegetation and snow can insulate the soil for air temperature extremes. I recall the morning of January 5, 1999, when we had a foot of snow on the ground and an air temperature of 25 degrees below zero. Because the winter had been mild up to that week, the soil temperature at 4 inches was 32 degrees, a difference of 57 degrees between 4 inches below ground and 5 feet above ground!

While the above site tracks temperatures at specific depths, the NOAA North Central River Forecast Center maintains a web site with observed frost-depths in Illinois and points to the north. For most of this winter, the frost depth has run in the neighborhood of 10 to 20 inches across Illinois with a few sites going deeper. Here is a screenshot of this morning’s map. While it doesn’t work on the screen shot, you can mouse-over the points on the map on the website and see the individual reports.

North Central River Forecast SoilT

Finally, Wayne Wendland, the former State Climatologist for Illinois, did a frost-depth study in Illinois using data collected from grave diggers from 1980 to 1996. He developed a network of sites across Illinois through the Illinois Cemetery Association and provided post cards that the grave diggers filled out every two weeks in winter. They noted frost depth, soil moisture, soil texture, ground cover, and exposure. The deepest observed frost depths during this period ranged from 5 inches in far southern Illinois to 30 inches in far northern Illinois. The results were published in the Transactions of the Illinois State Academy of Science (pdf).

April Already 4th Wettest on Record

Based on preliminary data, this April in Illinois is already the 4th wettest on record with 6.58 inches of precipitation. Average statewide precipitation for April is 3.77 inches. So we are already almost two inches above average.
According to the NWS forecast, more rain is expected across southern Illinois on Friday and Saturday. Therefore, it is possible that we will move up the list by the end of the month. In addition, some sites may have already reached their record for April, including the city of Chicago.

Top 5 Wettest Aprils

  1. 2011 with 7.40 inches
  2. 1957 with 7.13 inches
  3. 1927 with 6.95 inches
  4. 2013 with 6.58 inches
  5. 1944 with 6.50 inches

Precipitation Pattern Across the State

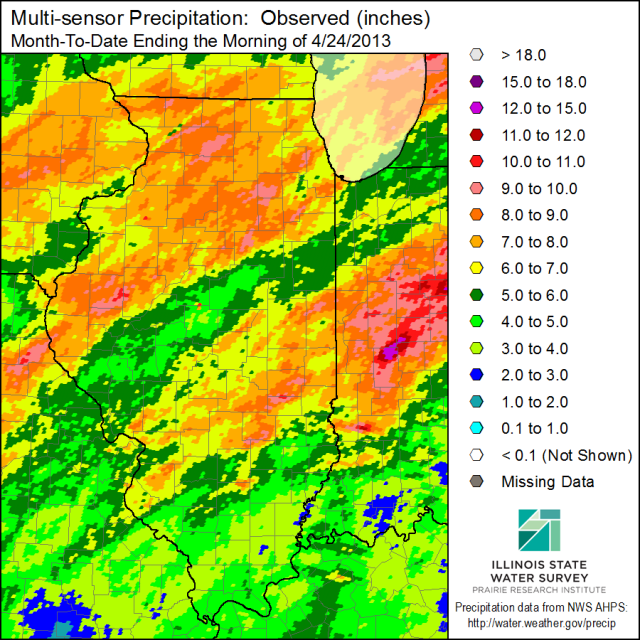
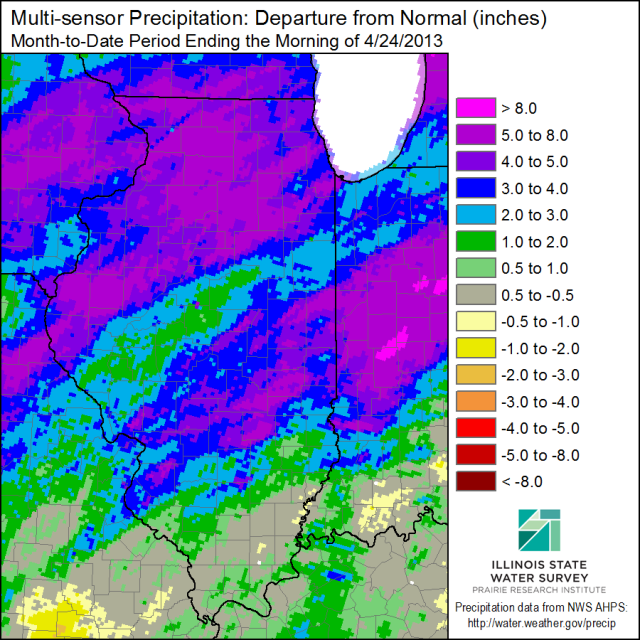
Here is how the precipitation has been distributed around the state, based on our multi-sensor precipitation product, with the actual amounts and the departures from average. Many parts of central and northern Illinois have more than double their average April precipitation (shades of purple in the second map).

April precipitation in inches for the first 24 days of the month. Click to enlarge.

April precipitation as departures from average. Click to enlarge.

New Climate Prediction Center Outlooks

On February 20, the NWS Climate Prediction Center released their new outlooks for March and beyond. Below are the maps for March, spring (March to May), and summer (June to August).
The overall theme for Illinois is an increased chance of above-average temperatures through August. We have an increased chance of above-average precipitation in the March-May period, followed by equal chances in the June-August period. If it pans out, above-average precipitation for this spring should help with low water levels on both the Great Lakes and Mississippi River as well as alleviate drought concerns in northern Illinois.
If you are wondering when was the last time we had a spring that was both warmer and wetter than average, you do not have to look very far. The springs of 2004, 2006, 2009, 2010, and 2011 all qualified as having both above average on precipitation and temperature. In fact, our spring temperatures in Illinois have been at or above average in all but 2 years since 1998 (last figure).

The Climate Prediction Center outlook for March and March-May. NOAA.

Climate Prediction Center outlook for summer (June-August).
Climate Prediction Center temperature outlook for summer (June-August).

Climate Prediction Center precipitation outlook for summer (June-August).

Spring Temperatures in Illinois since 1895. Source: http://www.southernclimate.org/products/trends.php
Spring Temperatures in Illinois since 1895. The green dots are the spring temperatures each year. The shaded curve represents a 5-year running average with extended periods of cool temperatures shaded in blue and extended periods of warm temperatures shaded in red. Source: http://www.southernclimate.org/products/trends.php

USDA Report Reflects Impact of Drought in Illinois

Last week the Illinois office of the National Agriculture Statistics Service released their report on crop yields in Illinois. The full report can be found here.
As expected, the Illinois corn yield for 2012 was only 105 bushels per acre, 52 bushels below last year. They noted that this was the lowest yield since 1988, when the average yield was only 73 bushels per acres. Because of the severe conditions of the corn crop, almost twice as many acres were harvested for silage in 2012 than in 2011.
Illinois soybean yield for 2012 was 43.0 bushels per acre, down 4.5 bushels from 2011. This was the lowest soybean yield since 2003, when the average yield was only 37.0 bushels per acre. While too late to do much good for corn, rains in the second half of August and the remains of Hurricane Isaac over Labor Day weekend may have provided some benefit to soybeans.
The one bright spot in the Illinois report was winter wheat production. The yield in 2012 was 63 bushels per acre, up 2 bushels from 2011. However, only 660,000 acres were seeded in the fall of 2011, which is down 140,000 acres from the previous fall. I suspect the decline was due in part to the already dry conditions experience in southern Illinois – the primary production area of the state.