Dryness Across Northern and Central Illinois

After a wet start to the 2014 growing season, we have seen a significant drop in rainfall across parts of northern and central Illinois in the last few weeks. Here is the 30-day rainfall as a percent of average. Areas in the orange are 25 to 75 percent of average while the areas in red are less than 25 percent of average. There are reports of soil moisture running low in some areas. On the other hand, southern Illinois has received above-average rainfall in the last 30 days.

IL-prcp-mpe-030-pct-20140818

Besides the switch from too wet to too dry in northern and central Illinois, and too much rain in southern Illinois, the other issue is that temperatures have been running about 4 degrees below average for the past 30 days. We are getting some heat this week. However, the longer-term forecasts indicate a return to cooler temperatures and more rain after this week through September 1.

If you look at the last 90 days the heavier rains in June and early July masks the recent dryness (map below). In fact, at the 90 day time scale rainfall in Illinois is generally at or above long-term average (1981-2010), as denoted by the grays and greens. This is one of the challenges of drought monitoring – sorting out short-term dryness versus long-term wetness or vice versa.

IL-prcp-mpe-090-pct-20140818


Cool Maps of the Cool July

I will admit it – ever since I was a kid I have been fascinated/obsessed with maps. It is probably why I ended up in a career in climatology since we use maps all the time.

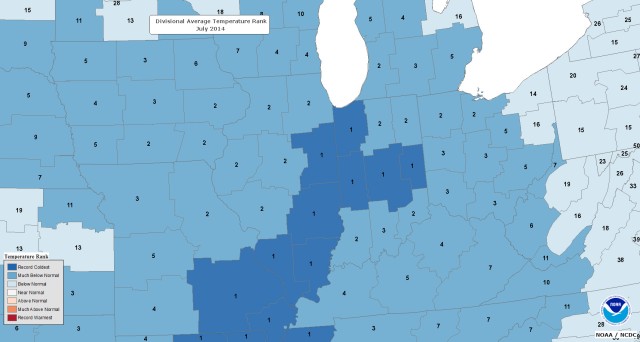
Here are maps from the National Climatic Data Center showing how cool July was across the Midwest. The regions are called “climate divisions” and there are nine of them in Illinois. The ones in the darkest blue had their coolest July on record, with records going back to 1895. Click on the map for a larger version which shows the numbers more clearly.

You can read more about what happened in the US in July.

July Temperature Ranking. Click to enlarge. Source National Climatic Data Center.

And here are the temperature departures from the 1981-2010 average.

July Temperature Departures. Click to enlarge. Source National Climatic Data Center.

Here is the US map for July, showing that while the Midwest was cool, the western US was experiencing record warmth.

july-us
Click to enlarge. Source National Climatic Data Center

This temperature pattern across the United States is the result of a ridge of high pressure over the western US and a trough of low pressure over the central US throughout most of July.

july-upper


Thursday Highlights – Drought Monitor and El Nino Forecast

Here are two highlights for today:

U.S. Drought Monitor

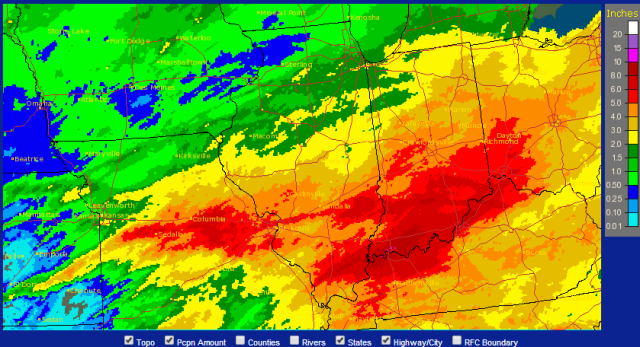
After some concerns of dryness over the last several months in parts of Illinois, the conditions across Illinois were much wetter in the last two weeks. Rainfall totals were especially heavy south of Interstate 72 and ranged from 3 to 8 inches or more (see map below).

The U.S. Drought Monitor has removed all areas of drought in Illinois and greatly reduced the region of “abnormally dry” conditions.

AHPSPrecipitationAnalysis

Climate Prediction Center El Niño Forecast

The NOAA Climate Prediction Center issued a new El Niño Watch today, saying …

While ENSO-neutral is favored for Northern Hemisphere spring, the chances of El Niño increase during the remainder of the year, exceeding 50% by summer.

This reflects a slightly stronger chance of El Niño arriving this summer than mentioned in their post a month ago. However, they caution that there is still a great deal of uncertainty in the timing and strength of the El Niño and recognize that the skill in forecasting El Niño this early in spring is low. This is a less certain forecast than the one issued by the Australian Bureau of Meteorology earlier this week, indicating that there was a greater than 70 percent of an El Niño event by June.

Soil Temperatures in Illinois

The Illinois State Water Survey maintains a network of 19 soil temperature sites across the state that measure temperatures at 4 and 8 inches. You can look at maps for 10 am, any hour of the day, high for the day, low for the day, under sod, and under bare soil. You can find all their data at this site: http://www.isws.illinois.edu/warm/soiltemp.asp 

Here is the 4-inch soil temperature from yesterday. It’s always a day behind so that they can upload the data and do quality control checks. The data now arrive hourly. My mistake – they used to upload the data once a day and do QC but now it is more timely. As you would expect, soil temperatures change more slowly than the air temperatures.

map


And here is what it looked like two years ago after a record warm March. I chose April 2, 2012 for the same time of day and depth. As you can see, the soil temperatures were about 12 degrees warmer and USDA NASS reported that 5% of the corn crop had already been planted by that date.

map (1)