30-Day Dry Spot in Corn Belt

As of July 13, 2011, the map of 30-day precipitation departures (figure below) showed a large area of below-average precipitation extending from eastern Iowa, through Illinois and Wisconsin and into parts of Michigan, Indiana, and Ohio. At first, this was not a concern because of the wet conditions that occurred through much of the spring. However, the lack of rainfall and hot conditions in the first part of July have begun to dry out the topsoil in Illinois. The rainfall departures range from 0.5 to 3 inches below average across northern and eastern Illinois.
Comparing the NASS report for  July 5 and July 11:

  • the Northwest crop reporting district (CRP) went from 11% dry to very dry topsoil to 30% dry to very dry in one week
  • the Northeast CRP went from 4% dry to very dry to 29% dry to very dry in one week
  • the East CRP went from 12% dry to very dry to 37% dry to very dry in one week.

The potential loss of water from soils from evaporation and transpiration from crops is on the order of 0.2 inches per day in Illinois now (link to potential evapo-transpiration maps). That means that we need about 1.4 inches of rain per week in July just to keep up with the demand from the crops. If the crops don’t get the water from rainfall then they have to rely more on soil moisture. So a week with no rain and temperatures in the 90s can dry out the topsoil quickly.
According to the Crop Watchers in the Illinois Farm Bureau’s FarmWeek, corn and soybeans in the sandy soils and in the thin soils on the ridges are showing signs of stress. Today we have seen slightly cooler temperatures across Illinois, along with some rain. However, the NWS is forecasting a return of hot weather over the weekend. In addition the NWS 6-10 day and 8-14 day forecast show a greater chance of above-average temperatures across all of Illinois. Those forecasts show a greater chance of below-average rainfall across the southern two-thirds of the state and near-to-above average rainfall in the northern third of the state.
While northern Illinois has been dry, much of southern and western Illinois has received much-above average rainfall, by as much as 2 to 5 inches or more in many locations. The wet conditions have led to flooded fields and widespread planting/replanting delays.

30-day precipitation departure
The 30-day precipitation departure as of July 13, 2011. Area circled in red shows less-than-average amounts. Source NOAA. Click to enlarge.

Warm November in Illinois

November

The statewide average temperature for November 2010 was 43.4 degrees, which was 1.6 degrees above normal. That makes it the 26th warmest November since statewide records began in 1895.
By the way, the 2000’s are well represented in the list of warm Novembers. Their rank and year include: #1 (2001), #5 (2009), #10 (2004), #14 (2003), #16 (2005), and #17 (2006).
The statewide average precipitation for November was 3.2 inches, only 0.1 inches below normal. November was exceptionally dry until the long Thanksgiving weekend arrived. Rains from that period signaled the recovery of soil moisture around the state. See the earlier posts on this subject.
The highest monthly total precipitation in Illinois for November was 7.15 inches recorded at Mt Carmel. The highest daily temperature for November was 82 degrees recorded at Cairo on November 13. The lowest daily temperature for November was 12 degrees recorded at Mt Carroll on November 26.

Fall

The statewide average temperature for fall (September-November) was 55.4 degrees, 1.2 degrees above normal.
The statewide average precipitation for fall was 8.6 inches, 0.8 inches below normal. Widespread rains in early September and late November masked the long period in between with dry conditions.
Note: these numbers are preliminary and subject to change as more data arrives.

First Half of November – Warm and Dry

First Half of November

The first half of November in Illinois has been warm and dry, according to preliminary data from November 1-15, 2010. The statewide average temperature was 47.3 degrees, 2.9 degrees above normal. The statewide average precipitation was only 0.21 inches, only 13 percent of normal for the first half of November.

Past November’s in Illinois

  • The driest November on record was 1904 with 0.28 inches.
  • November 2007 was the 25th driest with 1.75 inches.
  • November 2008 was the 20th driest with 1.48 inches.
  • November 2009 was near-normal with 2.47 inches.
  • Normal state-wide precipitation for November is 3.34 inches.

The term “normal” refers to the 1971-2000 average.

Precipitation percent of normal for first half of November 2010
Precipitation (Percent of Normal) for the First Half of November 2010.

October Was Warm and Dry in Illinois

Precipitation

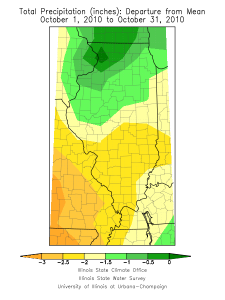
For Illinois, the statewide average rainfall for October was 1.4 inches, 1.5 inches below normal or 48 percent of normal. This ranks as the 20th driest October on record. The largest monthly rainfall total was reported at Belvidere with 3.94 inches. See map below for rainfall departures across the state.
While northern Illinois was close to normal on rainfall in October, parts of southern and eastern Illinois remained dry. The U.S. Drought Monitor lists those areas as “abnormally dry” and southeastern Illinois as”moderate drought”. At this time of year, the main impacts on agriculture would be on pasture conditions and winter wheat.

Soil Moisture

With the vegetation preparing for a long winter’s nap and lower temperatures, the demands on soil moisture are close to zero. So soil moisture should start to recover in the next few months even if precipitation remains below normal. The Illinois State Water Survey posts their latest soil moisture survey a few days after the end of the month here.

Temperature

The statewide average temperature for October was 56.2 degrees, 1.6 degrees above normal. The highest temperature for the month was reported at Fairfield with 93 degrees on October 10. The lowest temperature for the month was reported at Minonk with 22 degrees on October 29 and Sidell with 22 degrees on October 30.

Frost

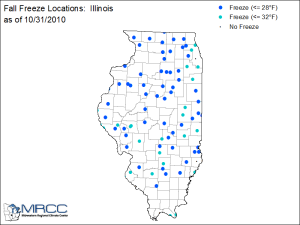
During October, nearly all of Illinois has experienced temperatures down to 32 degrees and many areas have reached 28 degrees or less. See map below.

Figures


October rainfall Illinois
October rainfall departures from normal.

freeze Illinois
Occurrence of Frost (32F) and Freeze (28F) in Illinois at end of October 2010.


All data are preliminary.