

Temperature
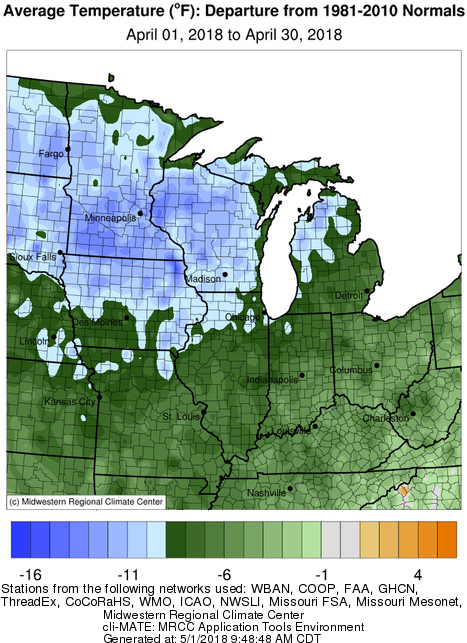
Based on the official data, the statewide average temperature was 44.5 degrees, 8.1 degrees below normal. It was the second coldest April on record, only beaten by 43.1 degrees set in April 1907. Our statewide records go back to 1895. Normal refers to a specific benchmark, the 1981-2010 average. See the longer explanation here.
Here are the temperature departures from normal look like across the Midwest. Areas in green are 1 to 9 degrees below normal, while areas in icy blue are 9 or more degrees below normal. The lowest temperature reported in Illinois for April was -1 at both Avon and Lincoln on April 2. At the other extreme, we did reach into the 80s at times during the month. The warmest reading was 86 degrees at Kaskaskia on April 13.
Precipitation Continue reading “Second Coldest April on Record in Illinois”
Second Driest October on Record for Illinois, But Not for Long
As of this morning, the statewide average precipitation in Illinois was 0.34 inches. That makes it the second driest October on record. However, the forecast for Tuesday will move us down in the rankings. In the meantime, here is where we stand for dry Octobers:
| Rank | Year | Amount | Departure | Percent of Average |
|---|---|---|---|---|
| 1 | 1964 | 0.18 | -3.06 | 6% |
| 2 | 2015 | 0.34 | -2.90 | 11% |
| 3 | 1897 | 0.46 | -2.78 | 14% |
| 4 | 1908 | 0.50 | -2.78 | 15% |
| 5 | 1895 | 0.60 | -2.64 | 19% |
| 6 | 1952 | 0.67 | -2.57 | 21% |
| 7 | 1904 | 0.71 | -2.53 | 22% |
| 8 | 1956 | 0.72 | -2.52 | 22% |
| 9 | 1915 | 0.83 | -2.41 | 26% |
| 10 | 1963 | 0.93 | -2.31 | 29% |
October Warm and Dry So Far in Illinois
October has been both warmer and drier than average so far for Illinois.
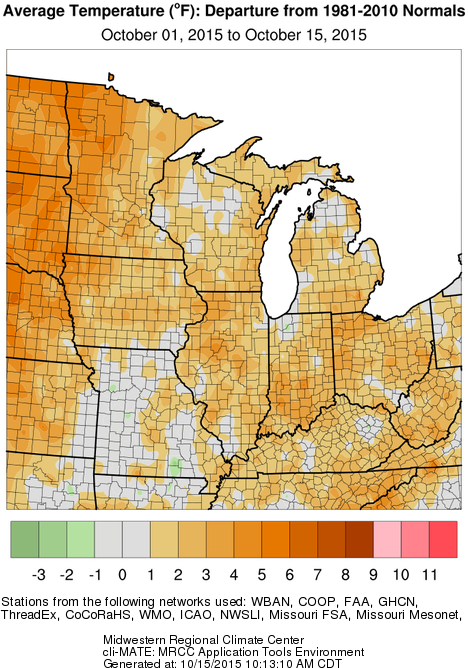
Temperatures have run 1 to 2 degrees above average in Illinois and across most of the Midwest (first map). This follows close on the heels of a September that is now considered the 8th warmest on record at 70.4 degrees according to NCEI.
Meanwhile, precipitation has been largely missing in action in October (map below). The areas in gray across Iowa, and parts of surrounding states indicate almost no measurable precipitation has fallen. It’s hard to tell on this map because of the scale, but most of Illinois has received less a tenth of an inch for the month so far. The statewide average is 0.05 inches. Continue reading “October Warm and Dry So Far in Illinois”
January 2015 in Illinois – Cool and Dry
January 2015 in Illinois was cooler and drier than average. The statewide temperature was 25.4 degrees, 1 degree below average and the 53rd coldest on record. However, it was not nearly as cold as last January when the average temperature was 19.3 degrees and ranked as the 16th coldest on record.
The statewide average precipitation for January 2015 was 1.53 inches, 0.5 inches below average. Because of dry weather in November, December, and January, the US Drought Monitor introduced “D0” in northern and western Illinois. As I explained in an earlier post, this is not a great concern yet because of the low demand for water in winter but we are watching the situation.
Snowfall ranged from less than an inch in the far south to 10 to 15 inches north of Interstate 80 (first map). That results in above-average snowfall in the northern half of the state and below-average for the southern half (second map). However, this was far less snow than January 2014 (last map) when most of the state was covered with 10 to 25 inches of snow. Continue reading “January 2015 in Illinois – Cool and Dry”