Drought Monitor Says Abnormally Dry – Should We be Worried?

The US Drought Monitor introduced their D0 “abnormally dry” category across northern and western Illinois (first map). Should we be worried? We have been running about 2 to 4 inches below average on precipitation this winter (second map) – that’s both rainfall and the water content of any snow. The good news is that the demand for water is very low in winter. Therefore, the impacts on soil moisture, stream flows, and lake levels so far have been minimal.

20150127_IL_trd
Click to enlarge. http://droughtmonitor.unl.edu/

Continue reading “Drought Monitor Says Abnormally Dry – Should We be Worried?”

Quiet Winter for Snowfall across central US

Snowfall across the central US has been slightly below average so far this winter and stands in stark contrast to last winter. However, the impact on soil moisture, rivers, and streams has been minimal.

Here is an example of snowfall differences. At Chicago O’Hare airport the snowfall total for this winter through January 14 is 13.7 inches. Last year through this date it was 35.0 inches and the 1981-2010 average is 14.2 inches.

In the first map are the snowfall departures for this winter. All the areas in tan or beige are up to 10 inches below average. That includes almost all of Illinois, Minnesota, Iowa, Missouri, Indiana, and Kentucky, as well as large portions of the Dakotas, Nebraska, Kansas, Wisconsin, Michigan, and Ohio. Areas in green are above average and include a small area in far southern Illinois and another around Moline. Snowfall is above average across upper Wisconsin and the Michigan UP.  Continue reading “Quiet Winter for Snowfall across central US”

May in Illinois: Warmer Than Average, Dry in the West

Temperature

Based on preliminary data, the statewide average temperature for May in Illinois was 63.9 degrees. That is 1.2 degrees above average and the first month to be above average in Illinois since October 2013.

Precipitation

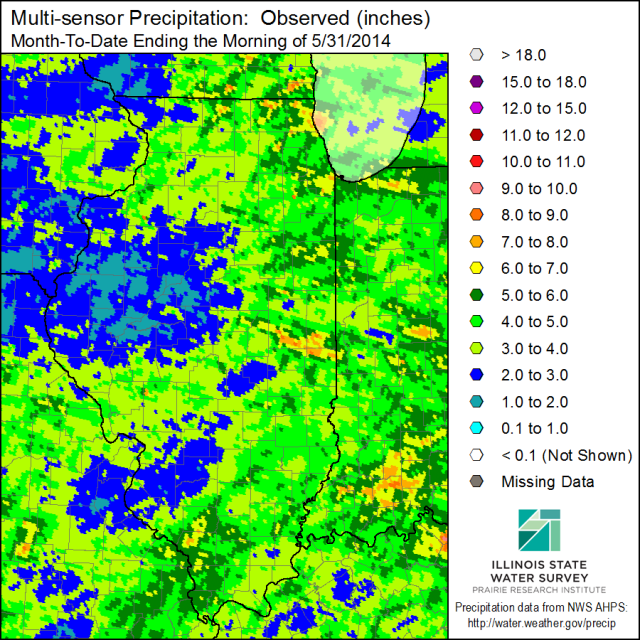
The statewide average precipitation for May in Illinois was 4.26 inches, just 0.34 inches below average. Below is a map of precipitation throughout the state. This is a radar-based product that is adjusted with rain gauges, resulting in higher resolution than a rain gauge network and more accuracy than a radar-only precipitation measurement. Sometimes hail can mislead the radar into calculating higher rainfall rates. That may have been the case in southern Champaign County, for example.

Some of the heaviest rainfall totals from the CoCoRaHS network for May occurred in Cook County, including Burnham-Hegewisch (IL-CK-82) with 7.64 inches and Homewood (IL-CK-64) with 7.58 inches.

The area of concern for May was the large section of blue across western and central Illinois, representing rainfall totals of only 1 to 3 inches. There are some smaller patches of blue in southern Illinois and far northwestern Illinois as well. One of the drier locations in west-central Illinois was Roseville (IL-WR-2) with only 1.32 inches with all 31 days reported. The US Drought Monitor list parts of western Illinois as “abnormally dry”.

IL-prcp-mpe-m2d-tot-20140531


Plots of Temperature and Precipitation

Here are the time series plots for temperature and precipitation departures for each month of 2013 and 2014. In the first plot, one can clearly see the string of very cold months from November 2013 to April 2014. On the second plot, the dryness of late last summer shows up. While March of this year was dry, it was counterbalanced by a wetter than average April.

image004

image009

First Half of March – Cold and Dry

Winter’s grip on Illinois is slowly releasing. However, we remain cold and dry for March. The statewide average temperature for March 1-16, 2014, was 30.3 degrees, which is almost 8 degrees below average. The good news is that the average, or normal, temperatures are climbing rapidly through the month. As a result, being 8 degrees below average in mid-March is still warmer than this winter. The NWS Climate Prediction Center 6-10 and 8-14 day forecasts show the below-average temperatures to continue through the end of March.

Besides the cooler temperatures, another concern at this point is the below-average precipitation (in shades of yellow and orange) for March so far. This is true not only across Illinois but much of the Midwest.

MonthPDeptMRCC
March Precipitation Departure from Average (inches). Click to enlarge.

Below are the 90-day precipitation departures from average. Above-average precipitation (shaded in green) can be found in IL, IN, OH, and MI, due for the most part to our generous snows and a few rain events. However, parts of southeastern IL are 1.5 to 3 inches below average. This is part of a larger area of dryness covering Missouri and parts of KS, OK, and AR. Of course this pattern could change quickly as we get out of winter and into spring. A few good spring rains could erase most of this deficit. In the meantime, we will be watching this area closely.

90dPDeptMRCC