Friday Roundup in Illinois

It is no surprise that June has turned into a wetter-than-average month. The statewide precipitation in Illinois is sitting at 6.1 inches, 1.9 inches above average. Several locations in central and northern Illinois have reported rainfall totals in the 8 to 10 inch range. Two of the highest so far are Dixon (IL-LE-17) with 10.15 inches and Galena (IL-JD-2) with 10.12 inches. We will have the final statistics on June next week.

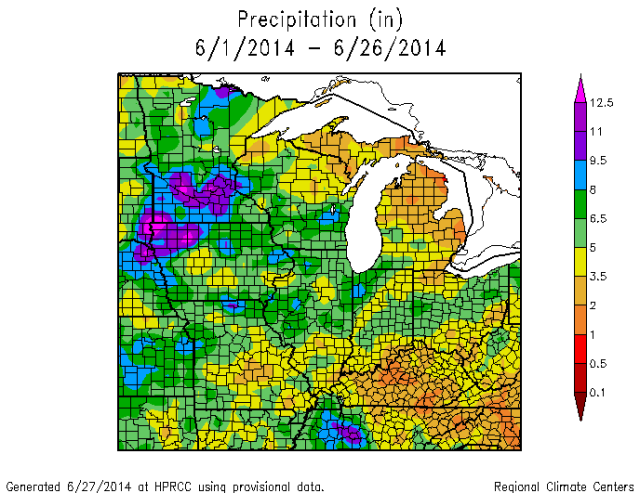
As the map below shows, areas in green and blue are in the 5 to 12 inch range, and are common across central and northern Illinois, as well as northern Missouri, Iowa, Minnesota, southern Wisconsin, and parts of Indiana.

MonthPDataMRCC

Of course, lots of rain means lots of runoff and flooding. Most of the rivers and streams in Illinois and the Midwest are having relatively high flows, shown by this USGS map. The green dots show flow in the normal range, blue dots indicate above normal flow, and black dots are record flows for this date.

USGS WaterWatch    Streamflow conditions


Finally, the Chicago area has not only struggled with heavy rainfall events that have caused flooding in June, but they have had an unusually high number of days with fog. Here is the web page from the Chicago NWS office explaining what is going on with this fog.
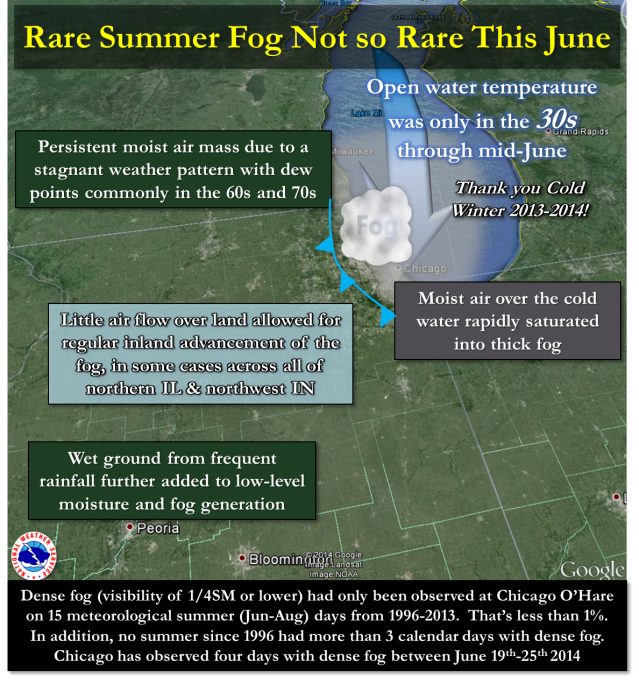
densefog
Click to go to original NWS article on the not so rare summer fog.


Study Gleans Insight on How Lake Breezes Move Through Chicago

Illinois State Water Survey scientist Dr. David Kristovich led a group of researcher examining lake breezes in Chicago and have released the following:

Lake breezes that bring some relief on a scorching summer afternoon are thought to move more slowly through Chicago than through the surrounding suburbs. Scientists at the Illinois State Water Survey have discovered that this is often not the case and have gained new insights into the mysteries of how cities affect winds off a lake.
Looking at 44 lake-breezes from Lake Michigan in the Chicago region from March to November 2005, Jason Keeler, a graduate student in the University of Illinois Department of Atmospheric Sciences, and David Kristovich, head of the Center for Atmospheric Sciences in the Illinois State Water Survey, found that in many instances, the lake breeze acted as if the city wasn’t there. Nearly 30 percent of the lake breezes moving through the city reached as far as 30 miles inland.

More on this study can be found here:
http://www.isws.illinois.edu/hilites/press/120501lakebreeze.asp

Year without Winter in Chicago?

The folks at the Chicago NWS office raised the following question. I would add to this that last winter Chicago O’Hare reported 57.9 inches of snow and 67 days with an inch or more of snow on the ground. This winter, through February 13, O’Hare reported 15.4 inches of snow and only 10 days with an inch or more of snow on the ground.

ANYONE UP FOR DUBBING 2011-2012 AS THE YEAR WITHOUT A WINTER? SO FAR
THAT HAS CERTAINLY BEEN THE CASE. SO FAR YEAR (THROUGH FEB 11)
CHICAGO HAS HAD THE 8TH WARMEST WINTER TO DATE AND ROCKFORD HAS HAD
THEIR 4TH WARMEST WINTER TO DATE. THE LAST TIME CHICAGO SAW A WINTER
THIS WARM UP UNTIL THIS POINT WAS 80 YEARS AGO BACK IN 1932!
TO PUT THINGS INTO PERSPECTIVE HERE`S A BREAKDOWN ON THE TALLY OF
ABOVE AND BELOW AVERAGE DAYS SO FAR THIS WINTER (THROUGH FEB 12TH):
                    CHICAGO         ROCKFORD
10F+ ABOVE AVG        43%             42%
ABOVE AVG             35%             34%
AVERAGE                4%              5%
BELOW AVG             15%             15%
10F+ BELOW AVG         3%              3%

Heavy Rain in Chicago on July 23

Chicago has a new all-time daily record rainfall when 6.86 inches fell during the early morning hours of Saturday, July 23, 2011, at O’Hare airport. The previous daily record was 6.64 inches set on September 13, 2008 (a little less than three years ago).
Even more amazing, the 6.86 inches of rain fell in slightly over three hours from 1 to 3 a.m. According to the ISWS Bulletin 70, the so-called 100-year, 3-hour storm for the Chicago area is 4.85 inches. Obviously, this storm far exceeded that. On a side note, the phrase “100-year storm” is a misnomer because it implies that you have a space of 100 years between storms. The slightly better phrase is “a once in 100 year return period on average“.  It’s best to think of it as the size of storm with a 1% chance of occurrence in any given year.
The folks at the Iowa Environmental Mesonet of the Iowa State University Department of Agronomy produced an amazing plot of the rainfall at O’Hare using 1-minute data. The black line is the hourly rate over 1 minute (rainfall rate in inches/hour). The green line is the hourly rate over 15 minutes. The red line is the hourly rate over 60 minutes. The blue line is the accumulated rainfall over time. The point of the 1-minute and 15-minute lines is to show that it was not a steady rain but contained several short periods with tremendous rain rates. One of those minutes exceeded 8 inches per hour (o.14 inches in one minute X 60 minutes = 8.4 inches/hour).
You can read more about the July 23 event at the Chicago NWS office link. Several CoCoRaHS observers had amounts that were even higher than O’Hare including two Arlington Heights observers with 7.25 inches (IL-CK-87) and 7.14 inches (IL-CK-81), one in Des Plaines (IL-CK46) with 7.24 inches, and one in Elks Grove Village (IL-CK-63) with 7.17 inches.

July 23 2011 Chicago rainfall
Plot of the 1-minute, 15-minute, and 1-hour rainfall rates and accumulated rainfall for the record July 23, 2011, rainfall in Chicago at O'Hare Airport. Figure courtesy of Daryl Herzmann, Iowa Environmental Mesonet. Click to enlarge.