

Temperature
Based on the official data, the statewide average temperature was 44.5 degrees, 8.1 degrees below normal. It was the second coldest April on record, only beaten by 43.1 degrees set in April 1907. Our statewide records go back to 1895. Normal refers to a specific benchmark, the 1981-2010 average. See the longer explanation here.
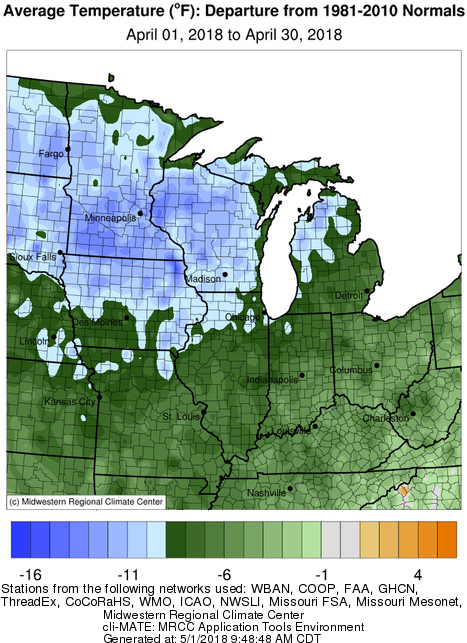
Here are the temperature departures from normal look like across the Midwest. Areas in green are 1 to 9 degrees below normal, while areas in icy blue are 9 or more degrees below normal. The lowest temperature reported in Illinois for April was -1 at both Avon and Lincoln on April 2. At the other extreme, we did reach into the 80s at times during the month. The warmest reading was 86 degrees at Kaskaskia on April 13.
Precipitation Continue reading “Second Coldest April on Record in Illinois”
April Temperatures in Illinois Warm Over the Last Century
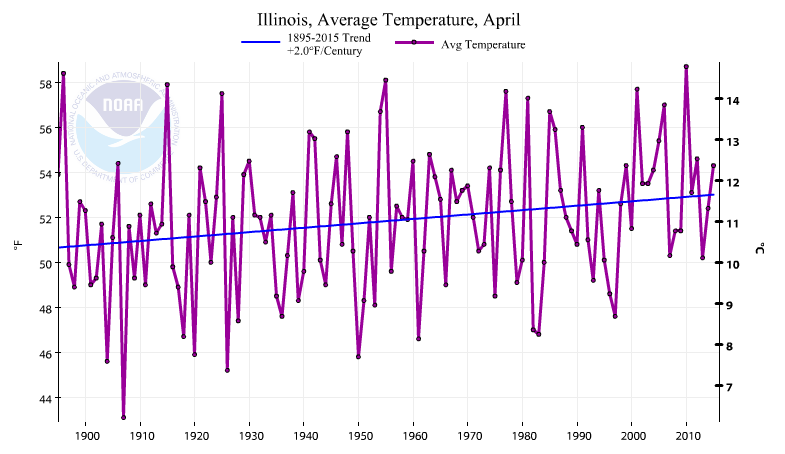
According to the National Centers for Environmental Information (NCEI), the average April temperature in Illinois has warmed by 2 degrees over the last century. In addition, the most recent decade of 2006-2015 was the warmest set of Aprils on record. Statewide records go back to 1895.
Here are the statewide average temperatures for April in Illinois plotted by year. The purple line and black dots show the year-to-year variability in April temperatures in Illinois. The blue line shows the upward trend. You can find the original data and graph here.
Continue reading “April Temperatures in Illinois Warm Over the Last Century”
Above-Average Temperatures for April in Illinois
While there were a few cold stretches in April, the statewide average temperature for the month was 54.1 degrees, 1.7 degrees above average.
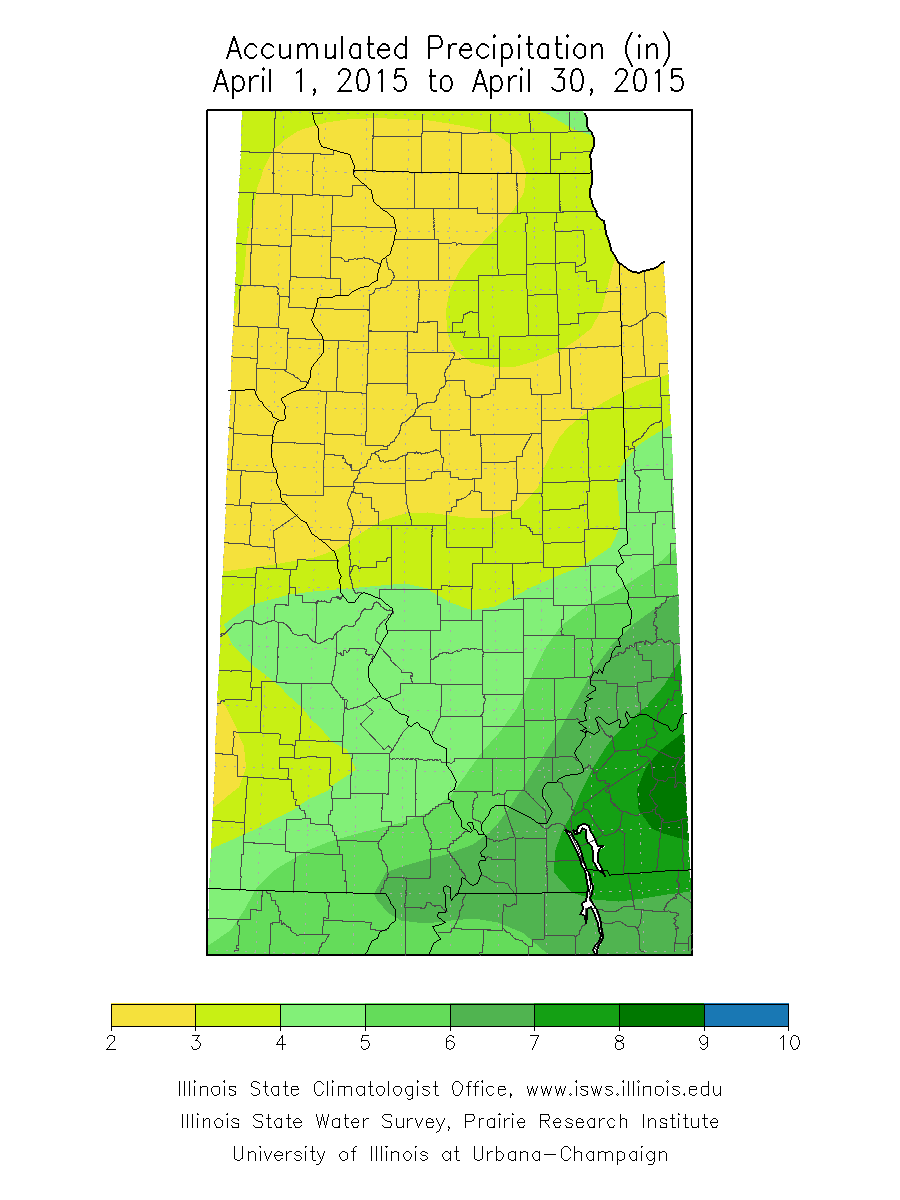
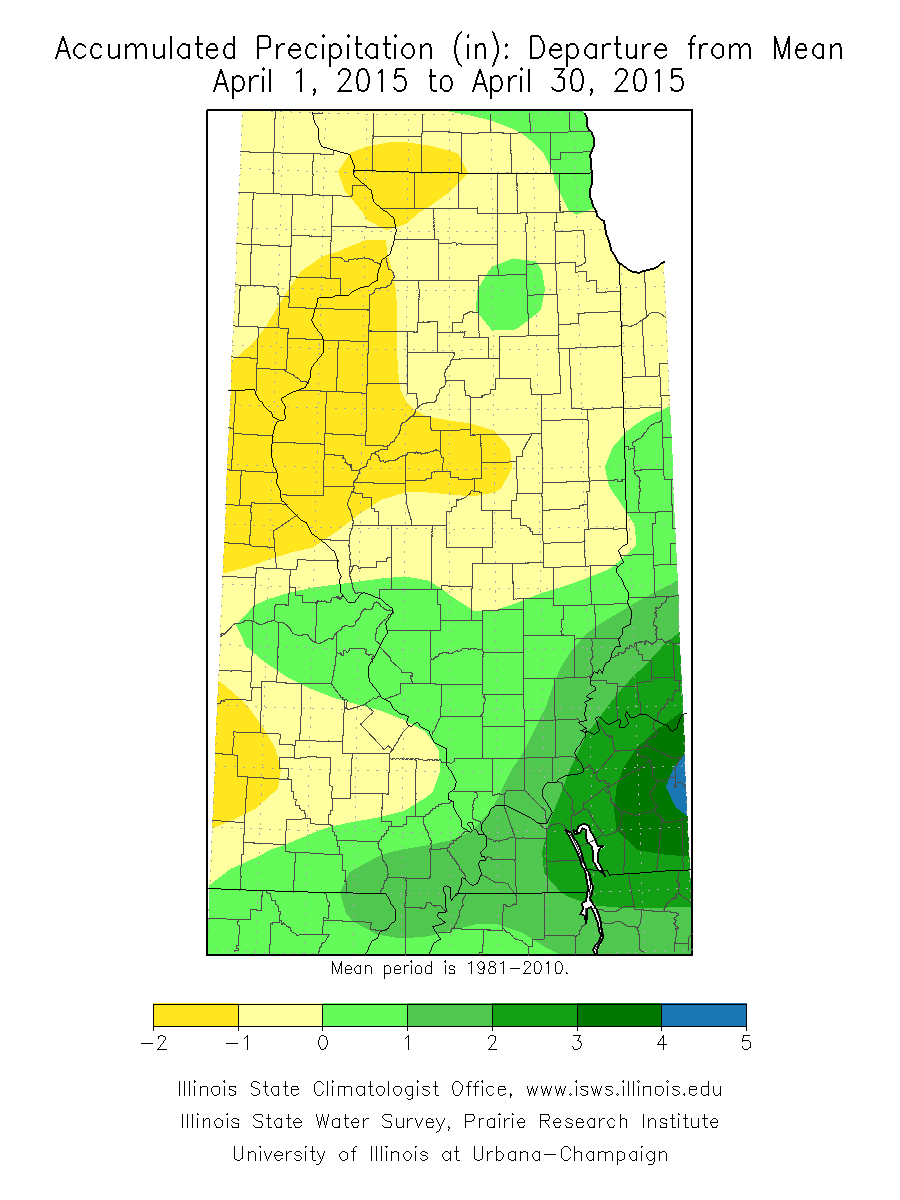
Precipitation in Illinois for April was more complicated. April precipitation was in the range of two to four inches in northern and central Illinois, and 4 to 7 inches in southern Illinois. As a result, the northern two-thirds of the state was slightly below average while the southern third was up to 2 inches above average. Fort Massac State Park reported the highest monthly precipitation total of 7.80 inches.
Continue reading “Above-Average Temperatures for April in Illinois”
April 4th Wettest On Record
Precipitation
This April was the 4th wettest on record for Illinois with 6.90 inches, based on the preliminary numbers. That was 3.13 inches above the long-term average of 3.77 inches.
To show you how wet it was, this April easily beat out the combined statewide rainfall totals for Illinois in May, June, and July of 2012 during the worst of the drought. The total rainfall for those months in 2012 were 2.50 inches, 1.80 inches, 1.48 inches, respectively, which led to a total of only 5.78 inches. That was 1.12 inches less than this April!
The first map below shows the spectacular rainfall totals across much of the state. The areas in yellow and orange were 6 to 9 inches. A few areas in pink and red were 9 to 11 inches. This product has a 4 kilometer resolution and is based on radar estimates calibrated with rain gauges.
The second map shows the same rainfall amounts expressed as a percentage of the long-term average. There was a small patch of below-average rainfall in far southern Illinois. Otherwise the rainfall across the rest of the state was much above average. Many areas in the dark blue were 2 to 3 times their long-average rainfall.
Speaking of rain gauges, the two largest monthly totals for April so far were Augusta with 12.28 inches and Naperville with 11.03 inches. Several more stations reported totals in the 10-inch range.
There were two major impacts of the wet April. One was widespread flooding on the Illinois, Wabash, and Mississippi Rivers and their tributaries. Several sites along the Illinois reported record high river crests in April. Because the flooding included the Chicago area, the dollar damages and number of people affected will be quite large.
The second impact of the wet April was the delay in fieldwork. In the April 29 USDA NASS report, only 1 percent of the corn crop was planted, compared to 76 percent last April, and a five-year average of 36 percent.
Temperature
The statewide average temperature was 50.1 degrees and 2.3 degrees below average. That was not record-setting but reflects the fact that we had a lot of cool, cloudy days in April.
Figures

