Very Mild December in Illinois

The preliminary statewide average December temperature was 39.2 degrees, 7.6 degrees above the 1991–2020 average and the 3rd warmest on record going back to 1895. The preliminary statewide average total December precipitation was 2.99 inches, 0.56 inches above the 1991–2020 average and the 30th wettest on record statewide.    

Data are provisional and may change slightly over time.

Where is Winter?

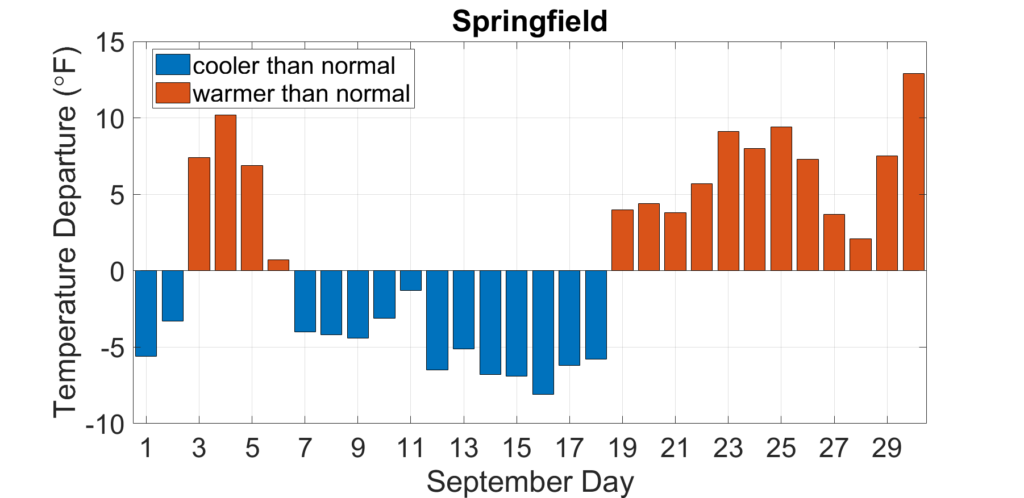
For the second time in three years Illinois has experienced an extremely mild December. All but three days last month were warmer than normal in Decatur, and several days in the second and fourth weeks of the month were 10 to 20 degrees warmer than normal (Figure 1).

Figure 1. Daily December average temperature departures in Decatur.

Table 1 shows the December average temperature, departure from normal, and ranking for several locations in Illinois. Last month was the 2nd warmest December in Rockford, the 3rd warmest in Peoria, and the 4th warmest in Chicago and Moline. None of the 120+ National Weather Service stations in Illinois recorded a low temperature in the single digits last month, and many places hit the freezing mark only a handful of nights.       

Table 1. December average temperature, departure from normal, and ranking in several places in Illinois.

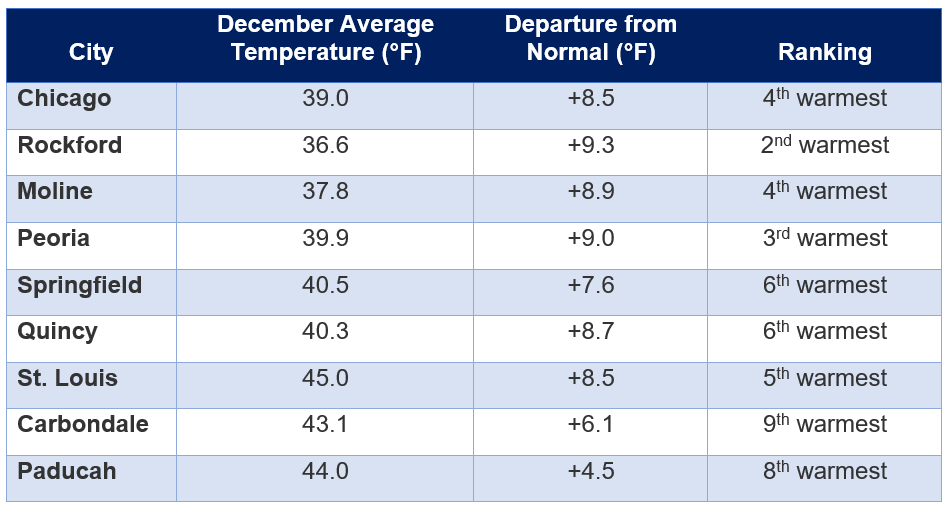
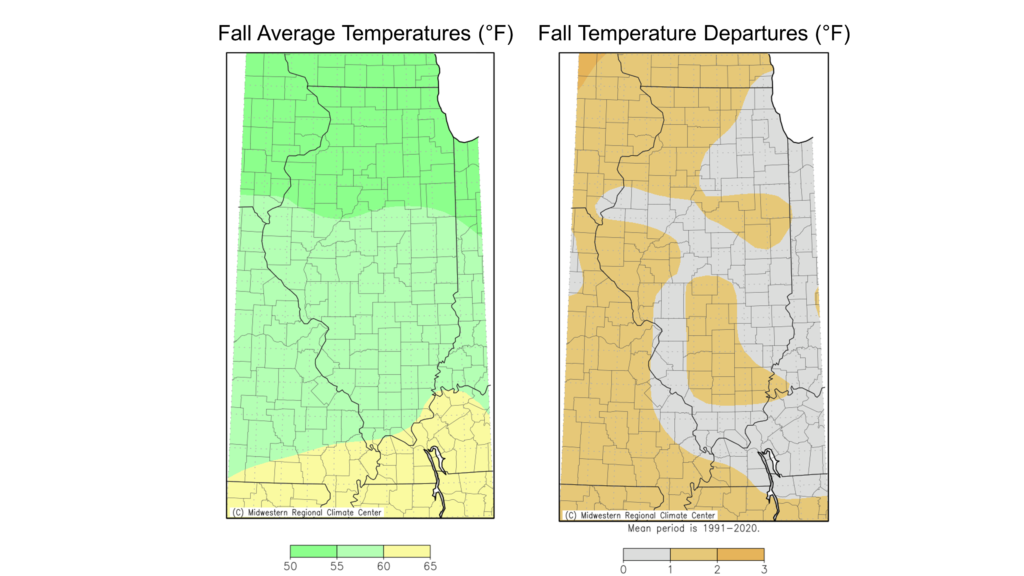
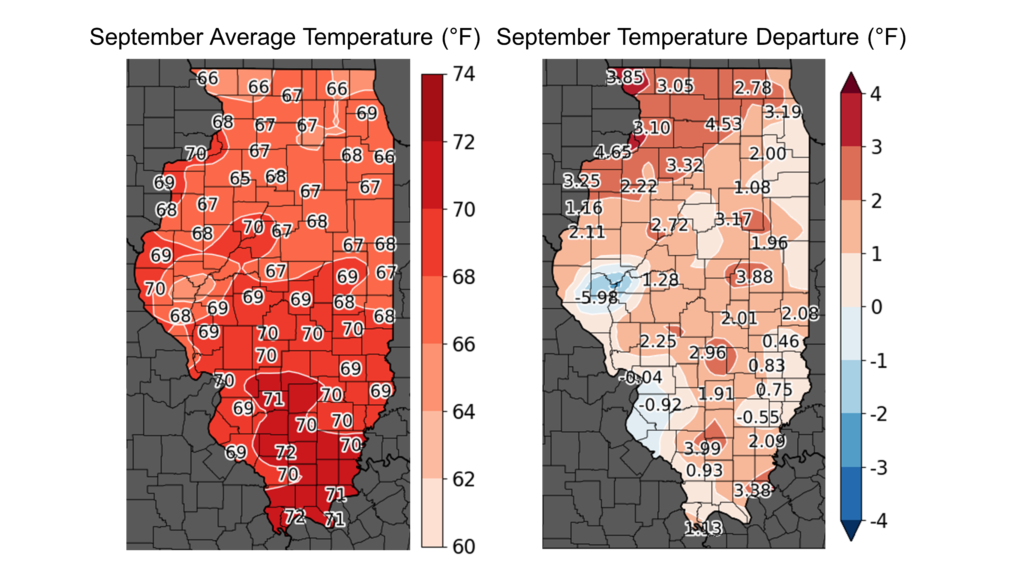
When taken altogether, December average temperatures ranged from the low 30s in northern Illinois to the low 40s in southern Illinois, between 6 and 10 degrees above normal (Figure 2). The warmest place in the state last month was Du Quoin with an average December temperature of 46.1 degrees. The coolest place in the state was Stockton in Jo Daviess County with an average December temperature of 33.9 degrees. It is important to note that the nighttime low temperatures last month were much higher than normal. The preliminary average December minimum temperature in Illinois is 32.2 degrees, which would be the 2nd highest on record statewide.  

Figure 2. Maps of (left) December average temperature and (right) December average temperature departures from normal.

The mild weather last month broke 20 daily high maximum temperature records and an incredible 99 daily high minimum temperature records. No daily low maximum or daily low minimum temperature records were broken last month.

Overall, the preliminary statewide average December temperature was 39.2 degrees, 7.6 degrees below the 1991–2020 average and the 3rd warmest on record going back to 1895.

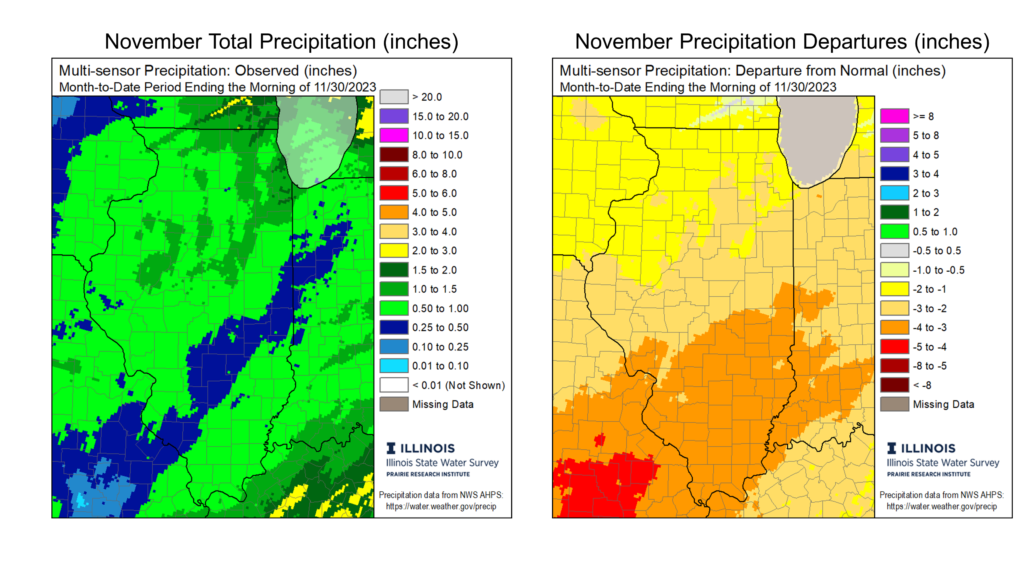
Split December Precipitation Pattern

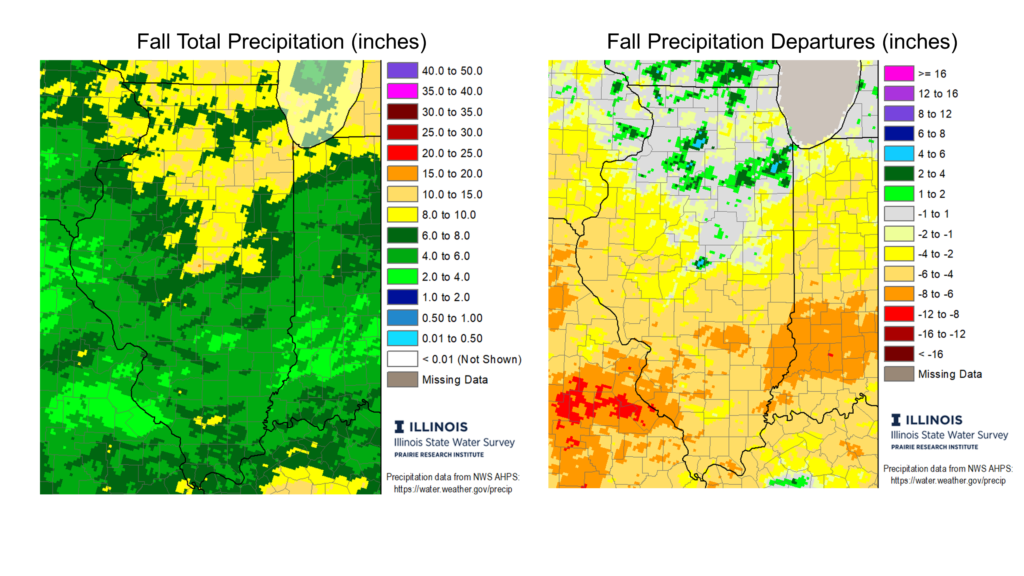
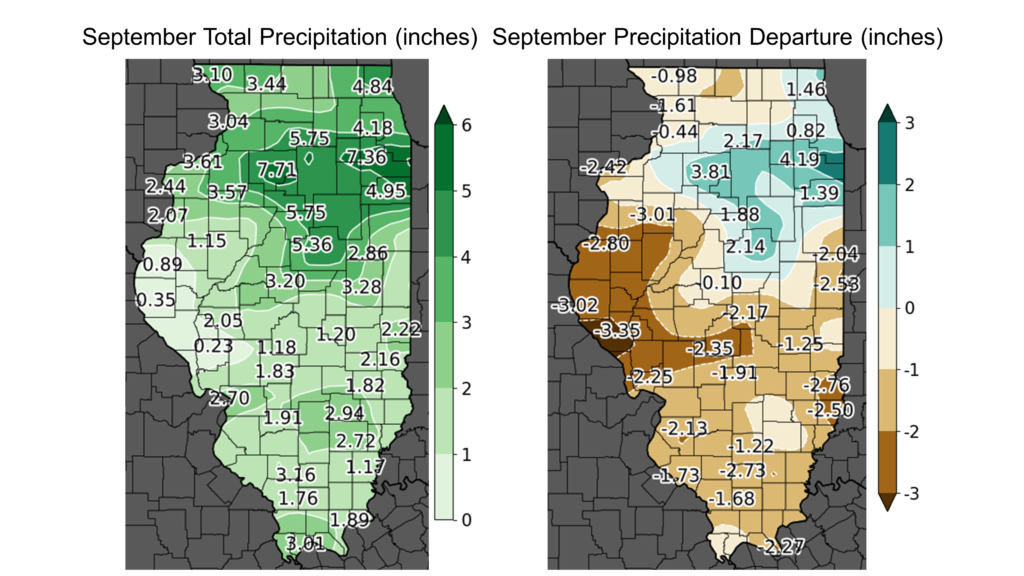
The first month of climatological winter brought a more active storm track to the Midwest than for most of fall. December total precipitation ranged from just over 4 inches in parts of northern Illinois to less than 1 inch in parts of far southern Illinois. Most of northern Illinois was around 1 inch wetter than normal, while most of the state south of Interstate 64 was 1 to 3 inches drier than normal in December (Figure 3).

Figure 3. Maps show (left) December total precipitation and (right) December precipitation departure from normal.

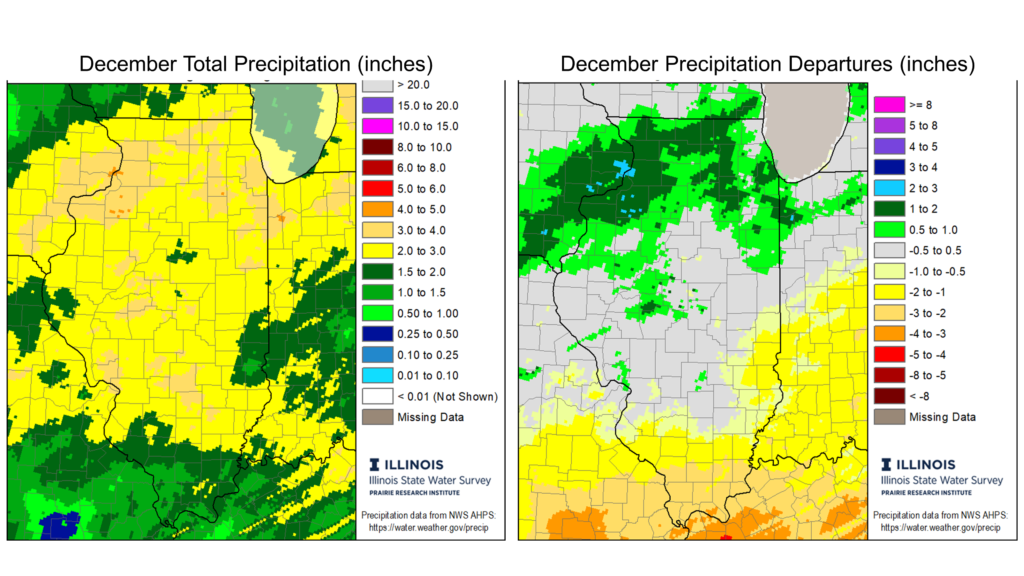
Overall, the preliminary statewide average total December precipitation was 2.99 inches, 0.56 inches above the 1991–2020 average and 30th wettest on record statewide.   

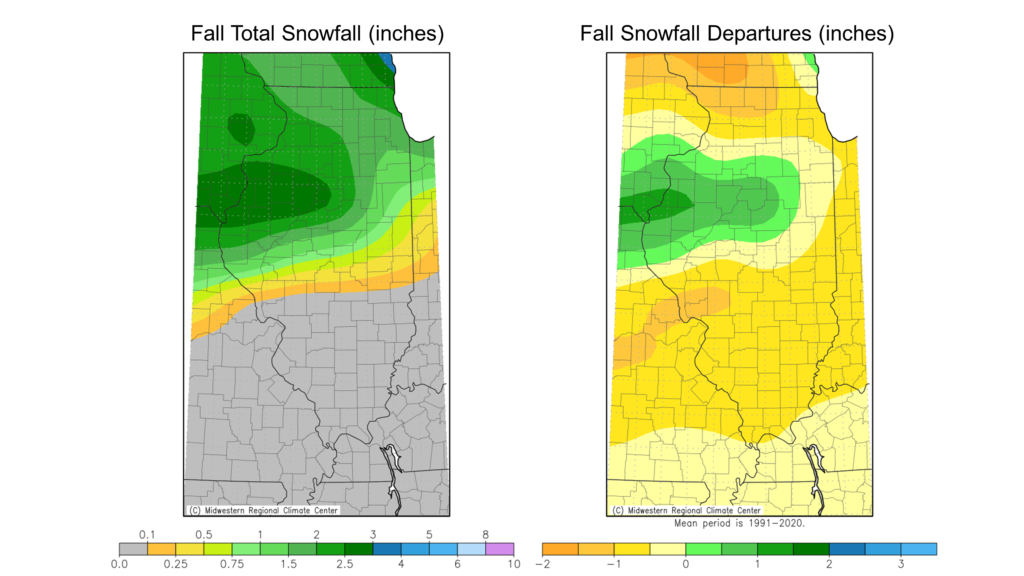
As is often the case in milder Decembers, snowfall was hard to come by across Illinois last month. December total snowfall ranged from around 4 inches in far northwest Illinois to less than a tenth of an inch in southern Illinois, between 1 and 8 inches below normal (Figure 4).
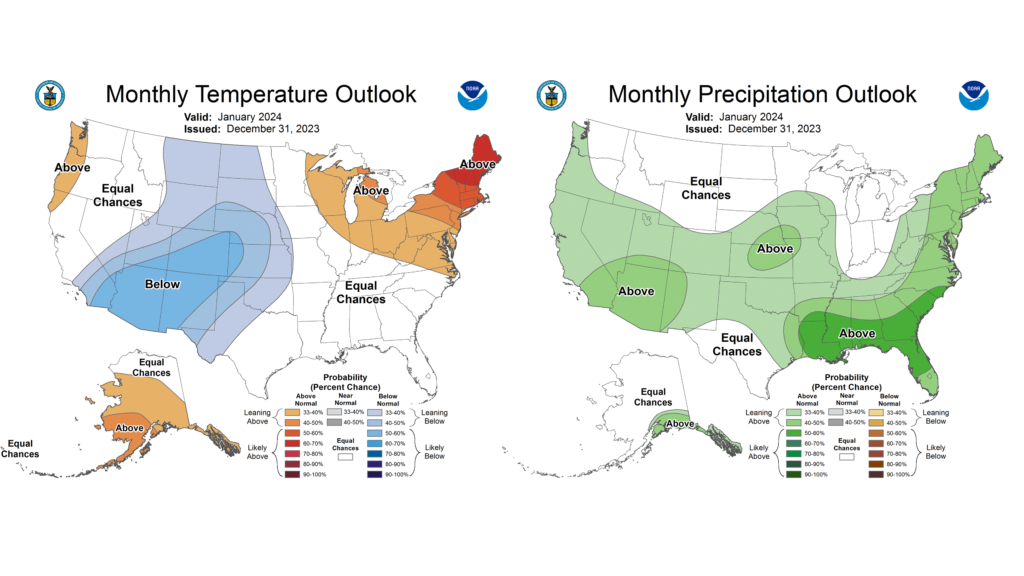
Figure 4. Maps show (left) December snowfall totals and (right) December snowfall departures from normal.

Outlooks

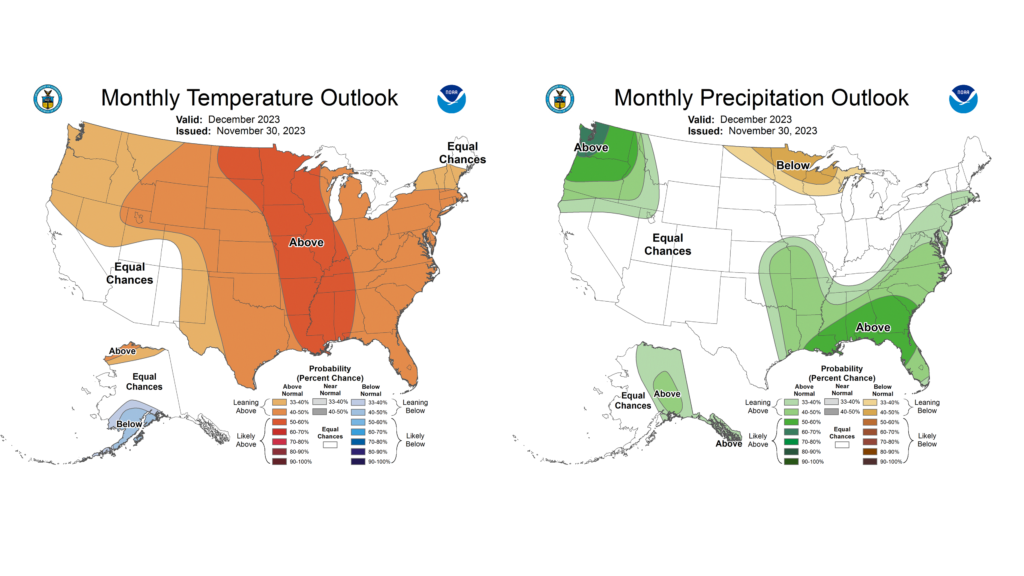
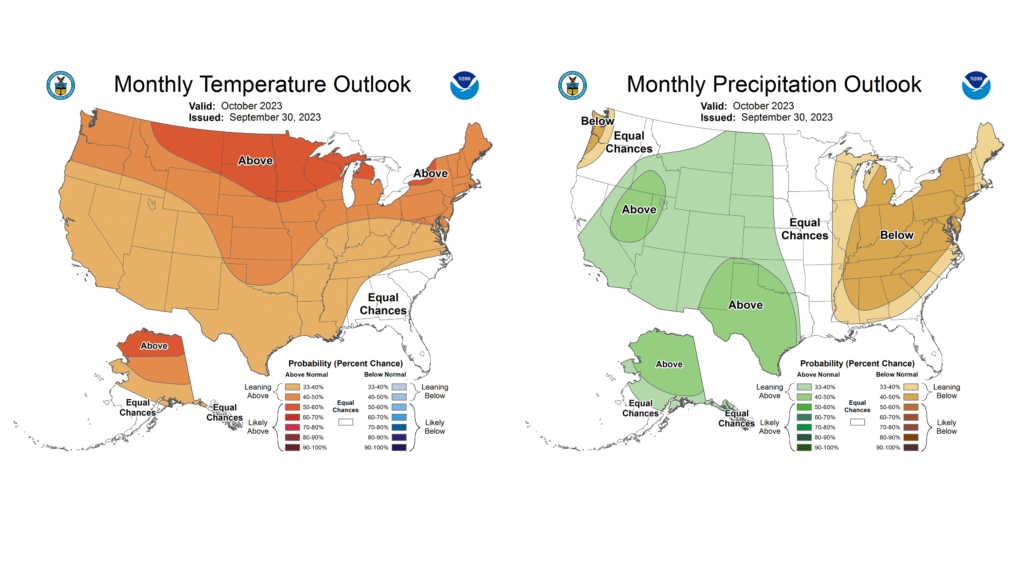
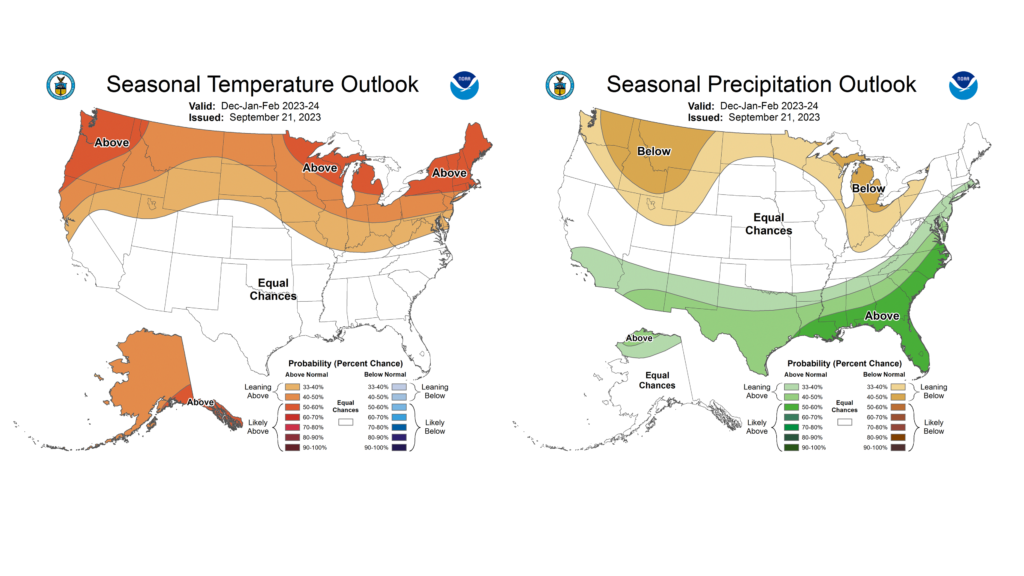
Climate Prediction Center outlooks for January are a bit different than the El Niño-esque patterns we’ve seen recently. Outlooks show mostly equal chances of above and below normal temperatures and precipitation for the first month of the season (Figure 5).

Figure 5. Maps show (left) temperature and (right) precipitation outlooks for January.

November Puts an End to a Warmer and Drier Fall

The preliminary statewide average November temperature was 42.3 degrees, 0.1 degree above the 1991–2020 average and tied for the 46th warmest on record going back to 1895. The preliminary statewide average total November precipitation was 0.74 inches, 2.34 inches below the 1991–2020 average and the eighth driest on record statewide.

Data are provisional and may change slightly over time. The official November precipitation total may be affected by the rainfall on the evening of November 30. Depending on if this precipitation is counted as on November 30 or December 1, which varies by the station, the official November total may be higher than the preliminary.

Mild November with a Chilly End

November can be a challenging month for those yearning for summer to come back. However, as daily average temperature departures in Dixon show, the past month brought mostly mild temperatures that felt more like mid-fall than early winter (Figure 1). Several days in the second and third weeks of the month were 5 to 10 degrees warmer than normal. Black Friday brought a big temperature change on the back of a strong cold front. The last week of the month saw temperatures that that were 5 to 15 degrees below normal, including several nighttime low temperatures in the single digits.

Figure 1. Daily November average temperature departures in Dixon.

November temperatures ranged from the high 40s in northern Illinois to the high 50s in southern Illinois, around 1 degree above normal (Figure 2). Several places saw high temperatures into the 80s in early to mid-November, including 84 degrees in Lawrenceville and 82 degrees in Cahokia. Meanwhile, the last week of the month brought some extremely low temperatures, including 3 degrees in Minonk and 4 degrees in Aurora. The coldest point in the state last month was Elizabeth at 36.6 degrees, and the warmest point was Lawrenceville at 49.1 degrees.

Figure 2. Maps of (left) November average temperature and (right) November average temperature departures from normal.

Where is that November Rain?

Most of Illinois got a good shot of rain in late October and saw its first snow around Halloween. However, the state moved into a much drier weather pattern that persisted for most of November. Month-total precipitation ranged from nearly 3 inches in northeast Illinois to less than half an inch in parts of south-central Illinois. Northern Illinois was 1 to 2 inches drier than normal, and southern Illinois was 3 to 4 inches drier than normal (Figure 3). Last month was a top five driest November in several places in the state, including the second driest on record in Fairfield (Table 1).

Figure 3. Maps show (left) November total precipitation and (right) precipitation departure from normal across Illinois.


Table 1. November total precipitation and historical ranking at several locations in Illinois.

LocationNovember Total Precipitation (inches)Historical Ranking
Danville0.523rd driest
Fairfield0.602nd driest
Champaign0.645th driest
Joliet0.704th driest
Carbondale0.434th driest
Quincy0.368th driest
Chicago0.8512th driest
Centralia0.524th driest
Freeport0.718th driest

Overall, the preliminary statewide average total November precipitation was 0.74 inches, 2.34 inches below the 1991–2020 average and the eighth driest on record statewide.

Fall in Illinois

Climatological fall includes September, October, and November, and–for my money–it is the best weather season Illinois has to offer. This past season’s average temperatures ranged from the low 50s in northern Illinois to the low 60s in southern Illinois, around 1 degree above normal (Figure 4).

Figure 4. Maps show (left) average temperatures and (right) temperature departures for climatological fall.

Fall season total precipitation ranged from over 15 inches in northern Illinois to less than 4 inches in parts of southwest Illinois. The season was near 1 to 2 inches wetter than normal in northern and parts of central Illinois and was 4 to 8 inches drier than normal in southern Illinois. Last season was the driest fall on record in Chester, with a record back to the 1890s, and it was the fourth driest fall on record in Quincy and the driest since 1956. Speaking of Quincy, Gem City is well on its way to a top five driest calendar year of its 120+ year record. Drought has consequently been a constant in much of western Illinois this year, causing agriculture and water resource impacts.    

Figure 5. Maps show (left) maps of total fall season precipitation and (right) fall precipitation departures from normal.

Overall, the preliminary statewide average fall temperature was 55.7 degrees, 1.1 degrees above the 1991–2020 average and tied for the 27th warmest on record going back to 1895. The preliminary statewide average total fall precipitation was 6.87 inches, 2.82 inches below the 1991–2020 average and the 30th driest on record statewide.

Fall Snow

Snowfall before December is typical for central and northern Illinois, and, unlike post-March snowfall, is not universally despised. Most of northern Illinois saw its first measurable snowfall around Halloween, while central Illinois had to wait until the weekend after Thanksgiving to see the white stuff accumulate. Fall season snow totals ranged from a tenth to a quarter of an inch along the Interstate 72 corridor up to 5 inches between Peoria and Monmouth (Figure 6). Most of the state outside of the Peoria to Monmouth corridor is a little less than 1 inch beyond on season-to-date snowfall, thanks to milder October and November temperatures. It’s important to note that neither an early start to snowfall nor unusually high snow totals before December forewarn snowfall between December and February.

Figure 6. Maps show (left) season-to-date snowfall total and (right) snowfall departures from normal.

Outlooks

Welcome to winter! December brings in the coldest, snowiest season of the year. However, this winter also comes with a moderate-to-strong El Niño, which often moderates winter temperatures and limits snowfall. The December outlooks lead into that pattern, with the highest chances of above normal temperatures for the final month of the year (Figure 7a). Not much changes in the winter season (December–February) outlooks, with the highest chances of both warmer than normal and drier than normal conditions across the state (Figure 7b). 

Figure 7. Maps show (left) temperature and (right) precipitation outlooks for (top) the month of December and (bottom) the winter season (December–February).

New USDA Plant Hardiness Zones Map

The USDA released their new Plant Hardiness Zone map, which shows significant changes in Illinois’ hardiness zones, reflecting the impact of human-caused climate change. The newest Illinois maps is available here.

The Zones They Are A-Changin’

Plant hardiness zones represent the best estimate of the average annual extreme minimum temperature at any location and are based on temperature data over a particular time period, often 30 years. The newest hardiness zone map is based on weather data from 1991 to 2020, and like earlier versions, is divided into 13 zones across the United States.

The most obvious change between the new hardiness zone map and the 2012 map is a northward progression of zones 6a-6b and 7a (Figure 1). The boundary between zones 5b and 6a, representing an average annual extreme minimum temperature of -10°F, migrated 60 to 70 miles north, from around Springfield in the 2012 map to around Peoria in the 2023 map. The boundary between zones 6b and 7a, representing an average annual extreme minimum temperature of 0°F, migrated 40 to 50 miles north from Cairo in the 2012 map to the St. Louis Metro East area in the 2023 map. And for the first time we see a small sliver of zone 7b in the southern tip of Illinois. We also see an expansion of zone 6a around the broader Chicagoland area, spanning from Lake County to Kankakee County. The 6a expansion in northeast Illinois is likely due to a combination of long-term winter warming and urban sprawl and development in the region.   

Figure 1. Maps show USDA hardiness zone maps in Illinois from (left) 2012 and (right) 2023.   

An Unmistakable Climate Change Signal

One of the most consistent changes in Illinois’ climate that is directly linked to human-caused global warming is warming winters. In fact, climatological winter (December – February) average temperatures have increased faster than any other season over the past century (Figure 2a). In the winter, though, nighttime low temperatures have increased at a faster rate than daytime high temperatures. Furthermore, the most extreme low (i.e., cold) winter nighttime temperatures have increased faster than milder winter temperatures (Figure 2b). Practically, these changes have noticeably decreased the frequency and intensity of extreme cold and the risk of cold exposure for plants, animals, and humans.

There are benefits of less extreme winter cold, including a reduced risk of human health impacts and cold injuries to perennial crops and natural ecosystems. However, the obvious change in winter temperature across Illinois–as exemplified by these new maps–also brings significant shifts in plant and animal habitat suitability. Warmer winters, embedded in an overall warmer and wetter Illinois, may be more conducive to certain species of non-native, invasive plants, pests, and plant and animal diseases and vectors. We have seen recent examples of impacts from changing environment, habitat, and climate in Illinois, including growing incidences of ticks and tar spot.

Figure 2. Top panels show the season average temperature change between 1895 and 2021 by county. The bottom panel shows the distribution of daily nighttime low temperatures in winter in Chicago, separated by 30-year periods since 1951.

What About Variability?

The USDA hardiness zone maps represent average extreme winter temperatures, but do not explicitly account for year-to-year variability. For example, Springfield, which is squarely in zone 6a (-5 to -10°F) in the most recent map, experienced nighttime low temperatures below -10°F in 11 of the 30 years between 1991 and 2020. This means that while the average Springfield winter may be suitable for plants that can survive temperatures as low as -10°F, it is likely the city will experience temperatures below that threshold in multiple years over the next three decades. However, the overall frequency and intensity of these extreme winter temperatures in Springfield, and across Illinois, are decreasing. Therefore, the transition to a warmer winter climate in Illinois also comes with large year-to-year variability, which makes conservation and agricultural management more demanding. Significant damage to Illinois peaches from extreme cold in an otherwise mild winter last year is an example of this variability and its problems. Overall, winter climate change in Illinois is messy, and will continue to challenge farmers, gardeners, conservation professionals, and anyone else working hard to grow plants in the prairie state.

Figure 3. Plot of annual lowest nighttime temperature in Springfield since the 1880s.

September Brought a Mix of Summer & Fall

The preliminary statewide average September temperature was 68.1 degrees, 1.3 degrees below the 1991–2020 average and tied for the 38th warmest on record going back to 1895. The preliminary statewide total September precipitation was 2.64 inches, 0.71 inches below the 1991–2020 average and the 42nd driest on record.

Data are provisional and may change slightly over time.

Fall Start and Summer Finish

September is a transition month as we move from summer into fall. However, this year September started with fall-like weather and ended with a shot of summer. Daily average temperature departures in Springfield show most days in the first two-thirds of the month were cooler than normal, followed by several days in the last two weeks that were 5 to 10 degrees warmer than normal (Figure 1).

Figure 1. Daily September average temperature departures in Springfield.

September average temperatures ranged from the mid-60s in northern Illinois to the low 70s in southern Illinois, between 1 and 4 degrees above normal (Figure 2). We should ignore the suspiciously low September average temperature near La Grange, Illinois because it is likely a measurement error. Several places hit highs in the low 90s in the latter half of September, including 94 degrees in Charleston and Aurora. Meanwhile, cooler weather in the first part of the month pushed some nighttime low temperatures into the 30s, including 37 degrees in Joliet and 39 degrees in Stockton.

The warm end to the month broke 10 daily high maximum temperature records and 10 daily high minimum temperature records. Additionally, 3 daily low maximum temperature records were broken last month.

Figure 2. Maps of (left) September average temperature and (right) September average temperature departures from normal.

Overall, the preliminary statewide average September temperature was 68.1 degrees, 1.3 degrees below the 1991–2020 average and tied for 38th warmest on record going back to 1895.

Dry Weather Kicks Off Harvest

Another interesting aspect of September is that rain in the first half of the month is generally welcomed by the agriculture community to help finish out beans and late-planted corn. However, rain after mid-September usually disrupts, if not delays, early harvest activity. September this year worked in the opposite way, with drier conditions early and a bit more rain later in the month.

September precipitation ranged from less than half an inch in western Illinois to over 7 inches in northeast Illinois. The northeast quarter of the state was 1 to 4 inches wetter than normal in September, while much of the rest of the state was 1 to 3 inches drier than normal (Figure 3). Last month was the eighth wettest September on record in Joliet, with 6.76 inches. Last month was the fourth driest September on record in Quincy with just 0.35 inches.

Figure 3. Maps of (left) September total precipitation and (right) September precipitation departures from normal.

Broader Midwest Drought

Drought is often considered an isolated event. A drought comes, it creates impacts, and it leaves. However, drought does not always go away with a wetter stretch of weather. In cases where multiple waves of drought are broken up by wetter periods, drought impacts can slowly accumulate. This phenomenon has been occurring in western Illinois, particularly around the Quincy area. That part of the state has moved in and out of moderate to extreme drought multiple times in the past 18 months, culminating in significant drought impacts. The 2022-23 water year, spanning October 1, 2022 to September 30, 2023 was the 3rd driest on record in Quincy, nearly 15 inches below the 30-year normal. Figure 4 shows the intense dryness over the past 12-18 months spans much of the Midwest from Kansas to central Indiana.

Figure 4. Map of water year precipitation deficits across the Midwest.

The Mississippi River has responded to the months-long Midwest drought with significantly reduced flow and near record low levels. Precipitation deficits over 12- to 18-month periods cannot be made up in a month or two, but instead require extended wetter weather over multiple seasons. Therefore, while a wet winter would be beneficial to improving soil, stream, and groundwater conditions, it is likely we’ll be coming into spring 2024 with some moisture deficits in parts of the Midwest.

Outlooks

October–in my humble opinion–is the best weather month of the year. Days become noticeably shorter, nights become cooler, and hoodies and shorts become the ultimate nightwear. The Climate Prediction Center shows higher odds of a warmer and drier than normal October (Figure 5), but no doubt there will be some beautiful fall weather. 

Figure 5. Maps of (left) temperature and (right) precipitation outlooks for October.

Meanwhile, October also brings in the first look at NOAA’s official winter prediction. This year, NOAA is leaning hard into El Niño with elevated chances of a warmer than normal winter season across Illinois, and slightly higher odds of drier than normal conditions in the eastern Midwest (Figure 6). It’s important to note that El Niño is an important component of seasonal climate variability in the Midwest but is only one of many important components to a winter season.

Figure 6. Maps of (left) temperature and (right) precipitation outlooks for winter (December–February).