The USDA released their new Plant Hardiness Zone map, which shows significant changes in Illinois’ hardiness zones, reflecting the impact of human-caused climate change. The newest Illinois maps is available here.
The Zones They Are A-Changin’
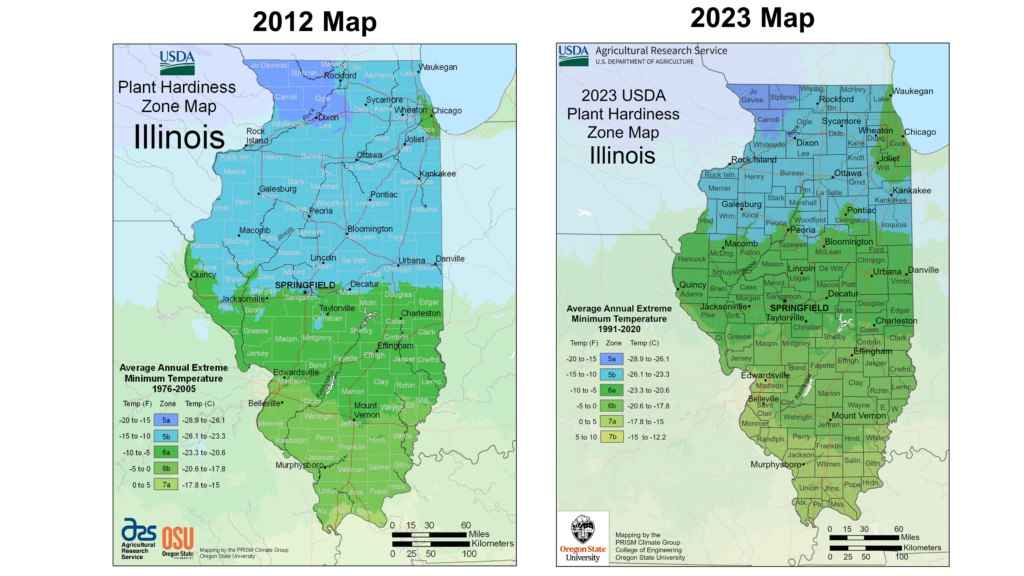
Plant hardiness zones represent the best estimate of the average annual extreme minimum temperature at any location and are based on temperature data over a particular time period, often 30 years. The newest hardiness zone map is based on weather data from 1991 to 2020, and like earlier versions, is divided into 13 zones across the United States.
The most obvious change between the new hardiness zone map and the 2012 map is a northward progression of zones 6a-6b and 7a (Figure 1). The boundary between zones 5b and 6a, representing an average annual extreme minimum temperature of -10°F, migrated 60 to 70 miles north, from around Springfield in the 2012 map to around Peoria in the 2023 map. The boundary between zones 6b and 7a, representing an average annual extreme minimum temperature of 0°F, migrated 40 to 50 miles north from Cairo in the 2012 map to the St. Louis Metro East area in the 2023 map. And for the first time we see a small sliver of zone 7b in the southern tip of Illinois. We also see an expansion of zone 6a around the broader Chicagoland area, spanning from Lake County to Kankakee County. The 6a expansion in northeast Illinois is likely due to a combination of long-term winter warming and urban sprawl and development in the region.
An Unmistakable Climate Change Signal
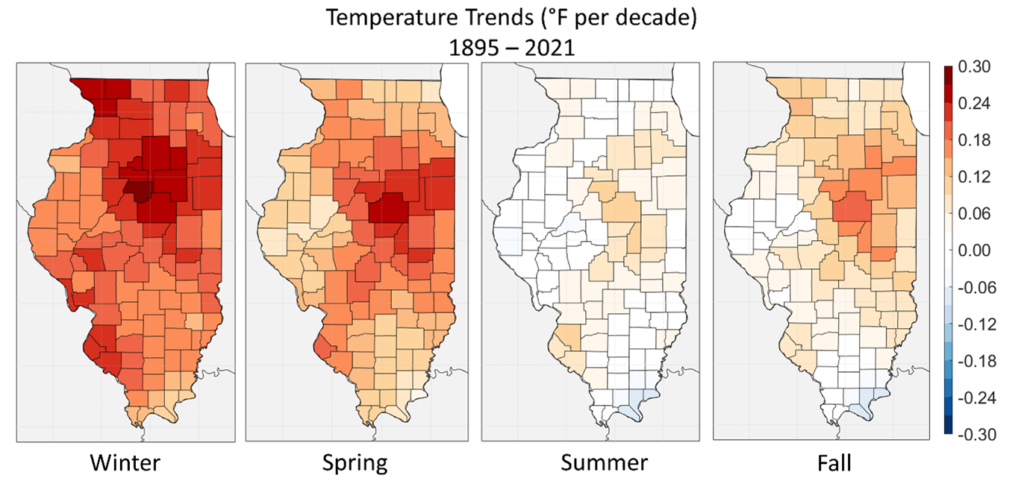
One of the most consistent changes in Illinois’ climate that is directly linked to human-caused global warming is warming winters. In fact, climatological winter (December – February) average temperatures have increased faster than any other season over the past century (Figure 2a). In the winter, though, nighttime low temperatures have increased at a faster rate than daytime high temperatures. Furthermore, the most extreme low (i.e., cold) winter nighttime temperatures have increased faster than milder winter temperatures (Figure 2b). Practically, these changes have noticeably decreased the frequency and intensity of extreme cold and the risk of cold exposure for plants, animals, and humans.
There are benefits of less extreme winter cold, including a reduced risk of human health impacts and cold injuries to perennial crops and natural ecosystems. However, the obvious change in winter temperature across Illinois–as exemplified by these new maps–also brings significant shifts in plant and animal habitat suitability. Warmer winters, embedded in an overall warmer and wetter Illinois, may be more conducive to certain species of non-native, invasive plants, pests, and plant and animal diseases and vectors. We have seen recent examples of impacts from changing environment, habitat, and climate in Illinois, including growing incidences of ticks and tar spot.

What About Variability?
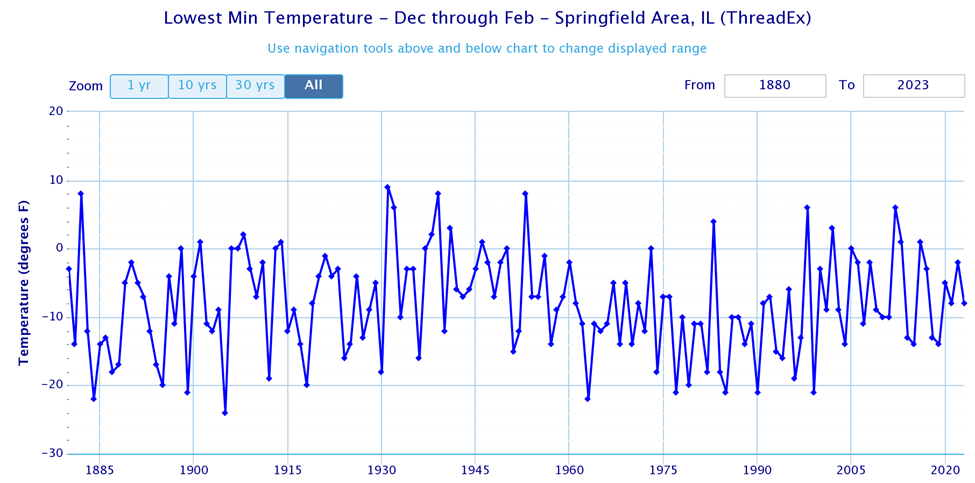
The USDA hardiness zone maps represent average extreme winter temperatures, but do not explicitly account for year-to-year variability. For example, Springfield, which is squarely in zone 6a (-5 to -10°F) in the most recent map, experienced nighttime low temperatures below -10°F in 11 of the 30 years between 1991 and 2020. This means that while the average Springfield winter may be suitable for plants that can survive temperatures as low as -10°F, it is likely the city will experience temperatures below that threshold in multiple years over the next three decades. However, the overall frequency and intensity of these extreme winter temperatures in Springfield, and across Illinois, are decreasing. Therefore, the transition to a warmer winter climate in Illinois also comes with large year-to-year variability, which makes conservation and agricultural management more demanding. Significant damage to Illinois peaches from extreme cold in an otherwise mild winter last year is an example of this variability and its problems. Overall, winter climate change in Illinois is messy, and will continue to challenge farmers, gardeners, conservation professionals, and anyone else working hard to grow plants in the prairie state.