Tornado Trends in Illinois – Updated

2014-03-21photo1
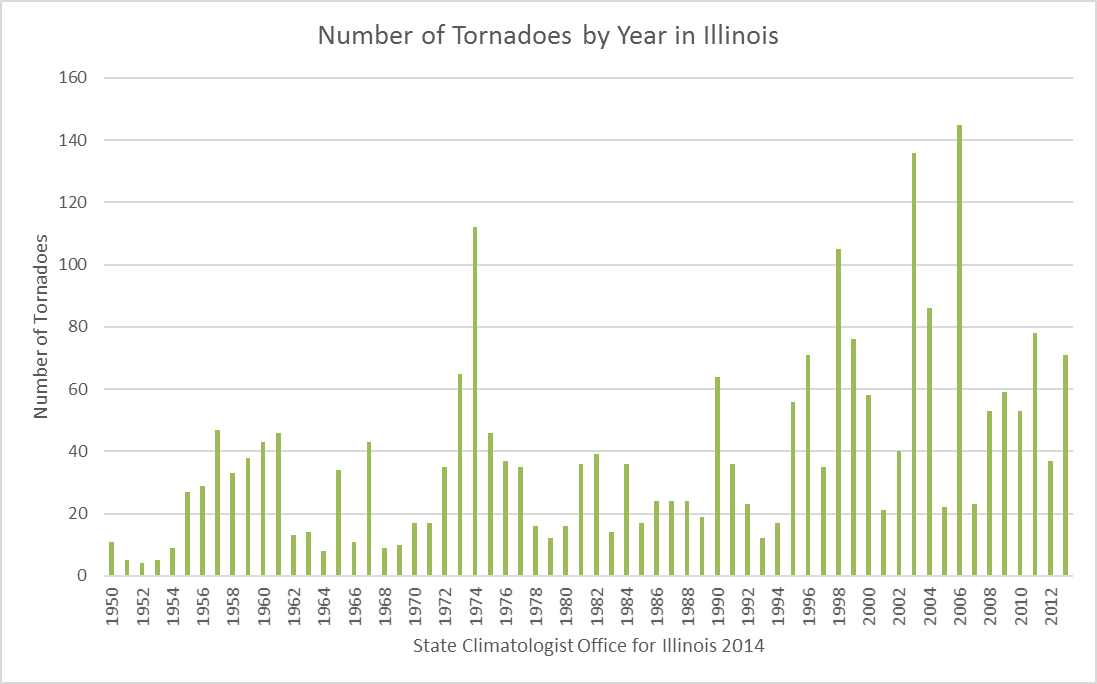
The tornado trends in Illinois has been updated to include data through 2013. The plots in order are the number of tornado reports by year, deaths by year, and injuries per year. Click to enlarge each plot.

These plots are based on storm data at the National Climatic Data Center (NCDC). Tornado records are notorious for not being consistent over time. It is nobody’s fault – technology changes and reporting techniques have improved over time. The newer NWS Doppler radar systems were installed in the 1990s, the spotter networks continue to improve, and everyone has a cell phone with a camera.  As a result, the number of tornadoes has increased in recent years with the better accounting.

In addition, there is always the potential for over-counting the number of tornadoes as they travel. For example, you might have a report for a tornado spotted 2 miles west of Smithville, and then another report 10 minutes later of a tornado north of Smithville. Was this the same tornado or two separate ones? Hard to tell without supporting evidence, especially before the modern-day radars.

I think the number of deaths and injuries by year in Illinois may actually be more reliable than the tornado frequency because they were just as widely reported in the media in the 1950s and 1960s as they are today. One can clearly see the spike in 1967 due to the Oak Lawn/Belvidere tornado outbreak and the 1990 spike from the Plainfield tornado. Sadly, the last two years have been bad in terms of fatalities in Illinois – 2012 with 9 deaths (Harrisburg, IL) and 2013 with 8 deaths (November 17, 2013 outbreak) after 7 relatively quiet years.

If you want to look at US trends, check out the NCDC page on tornado trends.

tornado-year

fatal-year

injury-year

Tracking Tornado Statistics in the US (Part II)

Yesterday I mentioned the national archive as a source for reports on tornadoes and other forms of severe weather. Today I wanted to mention the NOAA Storm Prediction Center and the many statistical products they have available on their website. Of course, their primary mission is to provide forecasts but they have accumulated an impressive collection of other products as well.

Local Storm Reports

While these are preliminary and subject to change later, one of the best and longest-lived product the SPC provides are the daily storm reports. These are dot maps showing tornadoes, wind and hail damage, with a detailed list below the map showing dates, times, cities, counties, type of damage. You can see “today” and “yesterday” or pick your own date. See example below (click to enlarge).

example1

Monthly and Annual Tornado Summary

This page starts by giving you a table of running totals of tornadoes and tornado deaths for this year, and the last 3 years, plus the 3-year average. So as of April 3, we have 81 tornadoes reported across the US with zero deaths.

TORNADO TOTALS AND RELATED DEATHS...THROUGH THU APR 3 2014
NWS STORM PREDICTION CENTER NORMAN OK
0833 AM CDT FRI APR 04 2014

       ...NUMBER OF TORNADOES...  NUMBER OF          KILLER
                                  TORNADO DEATHS     TORNADOES
    ..2014.. 2013 2012 2011 3YR                 3YR             3YR
    PREL ACT  ACT  ACT  ACT  AV   14  13  12 11  AV  14 13 12 11 AV
---  --   -- ---  ---- ---- ----  --  -- --- -- ---  -- -- -- -- --
JAN   4   --   75   79  16   57    0   1   2  0   1   0  1  2  0  1
FEB  41   --   39   57  63   53    0   1  15  1   6   0  1  7  1  3
MAR  25   --   18  154  75   82    0   0  43  1  15   0  0 10  1  4
APR  11   --   86  206 758  350    0   1  6 363 123   0  1  1 43 15
MAY  --   --  268  121 326  238   --  41  0 178  73  --  5  0  9  5
JUN  --   --  125  111 160  132   --   1   4  3   3  --  1  2  1  1
JUL  --   --   72   37 103   71   --   0   0  0   0  --  0  0  0  0
AUG  --   --   46   38  57   47   --   0   0  2   1  --  0  0  2  1
SEP  --   --   21   39  51   37   --   0   0  0   0  --  0  0  0  0
OCT  --   --   61   37  23   40   --   0   0  0   0  --  0  0  0  0
NOV  --   --   79    7  44   43   --   8   0  5   4  --  3  0  2  2
DEC  --   --   18   53  15   29   --   2   0  0   1  --  2  0  0  1
---  --   --  ---  ---- ---- ----  --  -- --- -- ---  -- -- -- -- --
SUM  81   --  908 939 1691 1179    0  55  70 553 227  0  14 22 59 33

PREL = 2014 PRELIMINARY COUNT FROM ALL NWS LOCAL STORM REPORTS.
ACT  = ACTUAL TORNADO COUNT BASED ON NWS STORM DATA SUBMISSIONS.

COMPARISONS BETWEEN PRELIMINARY AND ACTUAL COUNTS SHOULD BE AVOIDED.

..CARBIN..04/04/2014

And if you look beyond the table you can get a year by year summary for the US. For example, here is the summary for 2014 so far.

example3


I like to check the Illinois statistics periodically so I choose the year and then the state and look at reports like this one …

example2


Annual Fatal Tornado Summary

This is a nice, modern interface for mapping fatal tornadoes across the US.

Annual Fatal Tornado Summaries

Warning Coordination Meteorologist page

Because this page is geared towards NWS meteorologists, it has more extensive and technical information than the other pages. However, it has lots of information of general information. You can find maps of tornadoes by year, basic tornado climatology, number of watches issued by year, severe weather databases, and GIS support. For example, you can find the map of the number of tornadoes by county across the US.

tornadoes-by-county

Washington IL – 4 Months After the November 17 Tornado

2014-03-21photo1
The first thing you notice is the fireplace standing alone. If you click to enlarge the photo, you can clearly see debris that had been buried under snow all winter. You can see other damaged houses in the background as well as the ruined trees.

On Friday, I visited Washington IL to check on the recovery from the November 17, 2013, tornado event. The good news is that I saw lots of construction. The bad news is that a lot of damage remains. As a result of the harsh winter, very little clean up could be done in these conditions, let alone extensive construction. In fact, the city is still looking for volunteers to help with the cleanup. Other locations hit by the November 17 tornado outbreak are facing similar conditions.

While tornadoes can occur in any month of the year, our core season in March-June. In many cases, a community has a full construction season to recover from such a disaster. One of the unique aspects of this tornado outbreak is that it happened in mid November, with winter right around the corner. And not just any winter, but one of the harshest winters in a long time. Looking at the weather records for nearby Peoria, the low temperatures after November 17 quickly dropped below freezing with a few light snow events. By December, they had a full-blown winter. By the end of it, Peoria received 49.6 inches of snow, the second highest total behind the 52.5 inches in 2010-11. It was the 8th coldest December-February on record as well. It is no wonder that the cleanup effort has a long ways to go.

However, as they say, “spring brings hope” and on that spring day last Friday I saw signs of hope and recovery for Washington IL. My sympathies go out to all tornado victims as they heal physically, financially, and emotionally from this natural disaster.

2014-03-21photo2
Here is an example of a concrete slab wiped clean in the foreground and new houses under construction in the background. Friday was a nice day and the builders were running at 100%. Click to enlarge.
2014-03-21photo3
This house has been severely damaged with the loss of the roof and most of the upstairs walls. What I found haunting is that you can clearly to two twin beds on the right, another bedroom on the left. While it did not come out in the photo, there were clothes still hanging in the closet. Click to enlarge.
2014-03-21photo4
Another severely damaged house with the roof and several walls missing. By the front door is a piece of plywood with the words “OK” on it; hopefully indicating that the residents survived. Click to enlarge.

Winter and Spring Collide in Illinois

Thursday was an interesting weather day in Illinois. Many areas experienced a rapid melt of the snowpack as warm, humid air moved into Illinois. The by-products of this included heavy fog, rain, severe weather, and localized flooding. I was driving back from a meeting in Pittsfield and was chased by severe thunderstorms and tornado warnings all the way back to Champaign. As I approached Champaign, the visibility on Interstate 72 dropped to 20-40 feet as the warm, moist air blowing over the cold, snowy fields produced heavy fog.

Below is a map of the preliminary storm reports for Thursday, including several possible tornadoes in Illinois. Click on the map to link to the reports from the NOAA Storm Prediction Center.

February tornadoes are relatively rare but they do happen. The second graph is from a study of 2,239 tornado reports in Illinois (link to more plots). Of those, just 1.3 percent occurred in February. However, one event that occurred after that study was the deadly Harrisburg tornado that killed 8 people on February 29, 2012.

yesterday_filtered
NOAA Storm Prediction Center. Click to go to the reports for that day.

tornado-month