The statewide average March temperature was 47.7°F, 6.3° above the 1991-2020 normal for March and the 7th warmest March on record statewide. The statewide average total March precipitation was 2.76 inches, 0.18 inches below normal and the 58th driest March on record statewide.
March Temperatures Start and End Like a Lamb
March temperatures had ebb and flow that is typical of spring in Illinois, yet most days last month were 5 to 25 degrees warmer than normal, as shown by daily temperatures and departures in Elgin (Figure 1). The middle part of the month featured a particularly large temperature swing as a powerful cold front moved through the region. Average temperatures in Elgin dropped from nearly 70 degrees on March 15 to 22 degrees on March 17.
Figure 1. Daily March average temperatures and departures in Elgin.
March average temperatures ranged from the low 40s in northern Illinois to the mid-50s in southern Illinois, between 2 and 7 degrees above normal (Figure 2). Multiple waves of late spring-like weather brought temperatures reaching well into the 80s across the state, including 83 in Quincy and Decatur. Very cold weather, while fleeting, did bring temperatures well below freezing across the state, including nighttime low temperatures of 10 degrees in Lincoln and 12 degrees in Rockford. The coldest place in the state last month was Elgin with an average of 40.9 degrees, while the warmest was Smithland Lock and Dam in Massac County with an average of 53.1 degrees.
The milder weather broke 71 daily high maximum temperature records in Illinois and 13 daily high minimum temperature records. Meanwhile, no daily low minimum or low maximum temperature records were broken in Illinois last month.
Figure 2. Maps of (left) March average temperature and (right) March average temperature departures from normal.
Active March with Plenty of Severe Weather
March is the transition month between the normally driest time of the year in the winter and the normally wettest time of the year between April and July. Consequently, we have experienced years where March was extremely dry (only 1.13 inches in 1981) and those that were very wet (6.30 inches in 1973). This year March was only slightly wetter than normal statewide, but with some large gradients across the state.
Total precipitation ranged from less than 1.5 inches in far southwest Illinois to over 8 inches in northeast Illinois. The northern half of the state was 1 to 4 inches wetter than normal last month, while most areas south of Interstate 64 were 1 to 3 inches drier than normal (Figure 3).
Figure 3. March total precipitation (left) and March precipitation departure from normal (right).
While severe weather, including thunderstorms, strong winds, hail, and tornadoes, occur every month in Illinois, they tend to be most common between March and July. An active storm track and abundant moist, warm air from the Gulf of Mexico produced multiple severe weather outbreaks in March across the Midwest. In all, there were 58 tornado warnings issued in Illinois, the most on record for March (Figure 4). The NOAA Storm Prediction Center lists 33 tornado reports in Illinois last month, which may be adjusted before a final number is released. Included in these reports is a confirmed EF-2 tornado that caused significant damage to Neoga High School in Cumberland County on March 15, and multiple tornadoes that damaged or destroyed buildings in Douglas County on March 30.
Figure 4. Tornado warning frequency in March by year across Illinois. Graph is courtesy of the Iowa Environmental Mesonet: https://mesonet.agron.iastate.edu/.
As is the case in most years, March precipitation came in many forms, including snow. However, measurable snowfall was mostly contained to the northern third of the state. Monthly snowfall totals in those places that were able to measure the snow ranged from around 2 inches in the Quad Cities region to over 7 inches in parts of Knox County and Boone County in western and northern Illinois, respectively.
April and Early Growing Season Outlooks
Climatological spring starts with March, but most folks associate spring more with April and May, as weather in Illinois begins to consistently feel springlike. The outlook for April through June shows best chances of warmer and wetter than normal weather for much of Illinois. Most noteworthy is the warm and dry signal that dominates the mountain west and western plains in the first half of the growing season.
Figure 5. Climate Prediction Center (left) temperature and (right) precipitation outlooks for April through June.
Illinois was both warmer and wetter than the 1991–2020 normal in 2024. The statewide average annual temperature was 55.5 degrees, 2.9 degrees above normal and 2nd warmest on record statewide. Statewide average total precipitation in 2024 was 40.69 inches, 0.05 inches above normal and the 43rd wettest year on record.
The Second Warmest Year on Record
The past year was very warm in Illinois, but the largest temperature departures from normal were outside of the climatologically warmest time of the year. February, March, and November were all at least 4 degrees warmer than normal, while July and August were near to slightly cooler than normal statewide (Figure 1).
Figure 1. Plot shows 2023 statewide monthly average temperature (black line) and temperature departures from the 1991–2020 normal (red and blue bars).
Average temperatures in Illinois last year ranged from the low 50s in northern Illinois to the low 60s in southern Illinois, between 1 and 6 degrees above normal (Figure 2). The year 2024 was the warmest year on record in Chicago, Peoria, St. Louis, and Paducah, and it was a top 5 warmest year on record in the Quad Cities, Champaign-Urbana, Quincy, and Carbondale, among other places. The warmest point in the state last year was Dixon Springs in Pope County with an average temperature of 60.2 degrees. The coolest point in the state was Stockton in Jo Daviess County with an average temperature of 50.2 degrees.
Figure 2. Maps show 2024 annual average temperature (left) and average temperature departures from the 1991–2020 normal (right).
Last year was the warmest on record in Chicago, which stretches back to the 1870s. The weather station of record for the city of Chicago is currently at O’Hare airport; however, the station’s location has changed multiple times since the 1870s. For the first half of the record, the station was much closer to Lake Michigan, including in the Roanoke Building between 1873 and 1887 and Rosenwald Hall at the University of Chicago between 1926 and 1942. The Chicago National Weather Service office has a complete weather history for Chicago and Rockford: https://www.weather.gov/lot/observation_history.
Despite the likely moderating effect of the lake on temperatures in the early part of Chicago’s record, 2024 was still the warmest year since Ulysses Grant was president. Figure 3 shows the record of annual average temperature in Chicago, illustrating a long-term warming trend the city has experienced over the past 150 years.
Figure 3. Plot shows the annual average temperature in Chicago from 1873 to 2024.
Table 1 shows the number of daily weather records broken at Illinois Cooperative Observer stations in each month of 2024.
Our very mild February led with the highest number of daily high maximum temperature records, with 222 statewide. Meanwhile, the final three months of the year led with the most high minimum temperature records with 101, 67, and 64, respectively. The fleeting but intense cold air outbreak in mid-January in 2024 broke 73 low maximum temperature records and 28 low minimum temperature records. Multiple months had at least 100 daily high precipitation records broken last month, including January, April, July, and November.
Table 1. Table shows the number of daily local weather records in 2023 by month and variable.
2024 Precipitation
Calendar year 2024 had quite variable precipitation, with five months of wetter than normal conditions (January, April, July, November, December) and seven months that were drier than normal (Figure 4).
Figure 4. 2024 monthly total precipitation as a departure from the 1991–2020 normal.
Illinois experienced the 2nd driest February on record statewide, with only 0.48 inches of statewide average February precipitation, about 1.5 inches below normal. A wetter than normal April and May helped refill soils ahead of the growing season, but also delayed crop planting and critical fieldwork in many parts of the state.
For the third consecutive year Illinois fell back into drought in the fall as the months of September and October were 1 to 3 inches drier than normal across the state. Total precipitation in September and October statewide was only 3.48 inches, about 60% of normal and the 12th driest 2-month period on record. Once again, the region’s largest rivers approached low stage, including along the Illinois, Mississippi, and Ohio Rivers, causing some moderate challenges to shipping. November and December were both wetter than normal to end the year.
Figure 5 shows the spatial variability of 2024 precipitation in more detail. Total precipitation last year ranged from over 60 inches in far southern Illinois and the St. Louis Metro East area to less than 35 inches in parts of northern and north-central Illinois. Areas along the Wisconsin and Iowa borders were 2 to 6 inches wetter than normal last year, and areas around St. Louis and along the Interstate 70 corridor were 6 to 12 inches wetter than normal.
Figure 5. Maps show (left) total precipitation and (right) precipitation departures in 2024.
A CoCoRaHS citizen science observer in Metropolis in Massac County had 62.92 inches of precipitation in 2024, making the birth of Superman the wettest point in the state. Meanwhile, another CoCoRaHS observer in El Paso in Woodford County had only 28.22 inches of precipitation in 2024.
Overall, statewide average total precipitation in 2024 was 40.69 inches, 0.05 inches above normal and the 43rd wettest year on record.
2024 Severe Weather
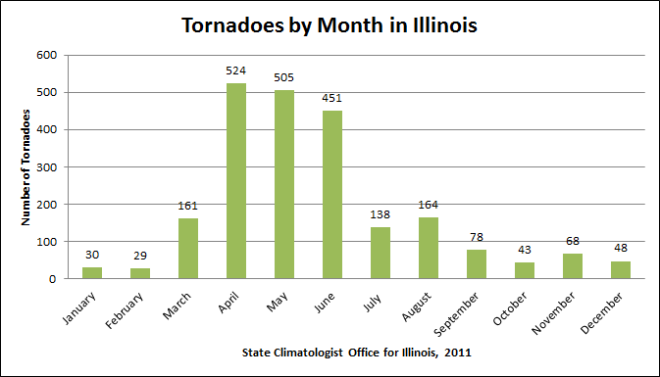
Severe weather came early and often in 2024, with all of our 102 counties affected by strong wind, hail, tornadoes, or heavy rain (Figure 6). Overall, the NOAA Storm Prediction Center reported a preliminary 142 tornadoes in Illinois in 2024, which would set a new annual tornado record, breaking the 124 event record in 2006, and follows the very active tornado year of 2023 with 121 tornadoes. Figure 6 shows the monthly frequency of tornadoes in 2024 compared to the 1994-2023 average frequency. February through May had above average tornado frequency, and then came a record-breaking July. The 7th month of the year ended with 45 tornadoes in the state, including a massive tornado outbreak in the Chicagoland area on July 15th. In total, the derecho on that evening brought 32 confirmed tornadoes, including several that made it into the Chicago city limits: https://www.weather.gov/lot/2024_07_15_Derecho.
Only one tornado was reported in the last four months of the year. It is likely the 2024 tornado total will be adjusted, but irrespective of changes, 2024 was an extremely active tornado year and very likely the most active tornado year on record in Illinois
Figure 6. Plot shows tornado frequency by month in 2024 (blue bars) compared to the 1994-2023 average (red bars).
The NOAA Storm Prediction Center also had 216 severe hail reports and 716 severe wind reports in Illinois in 2024. Many of the wind reports came from a strong derecho that moved through the state on June 29. Over one-third of all severe wind reports came on July 15th, including 100+ mph wind reports in Marshall County and Ogle County.
2024 Snowfall
Snow was hard to come by in 2024. Figure 7 shows snowfall departures from normal between January and May, September and December, and for the 2024 year as a whole. Most places in the state had between 5 and 20 inches below normal snowfall last year. Overall, the statewide average total snowfall was just under 12 inches in 2024, below the long term average of 19 inches (Figure 7).
Figure 7. Maps of snowfall departures from normal across Illinois and a plot of statewide average total snowfall in Illinois between 1904 and 2024. The maps show departures from (left) January through May, (middle) September through December, and (right) the entire year of 2024.
The Kansas City NWS office posted this image showing that rivers have no measurable effect on tornado tracks.
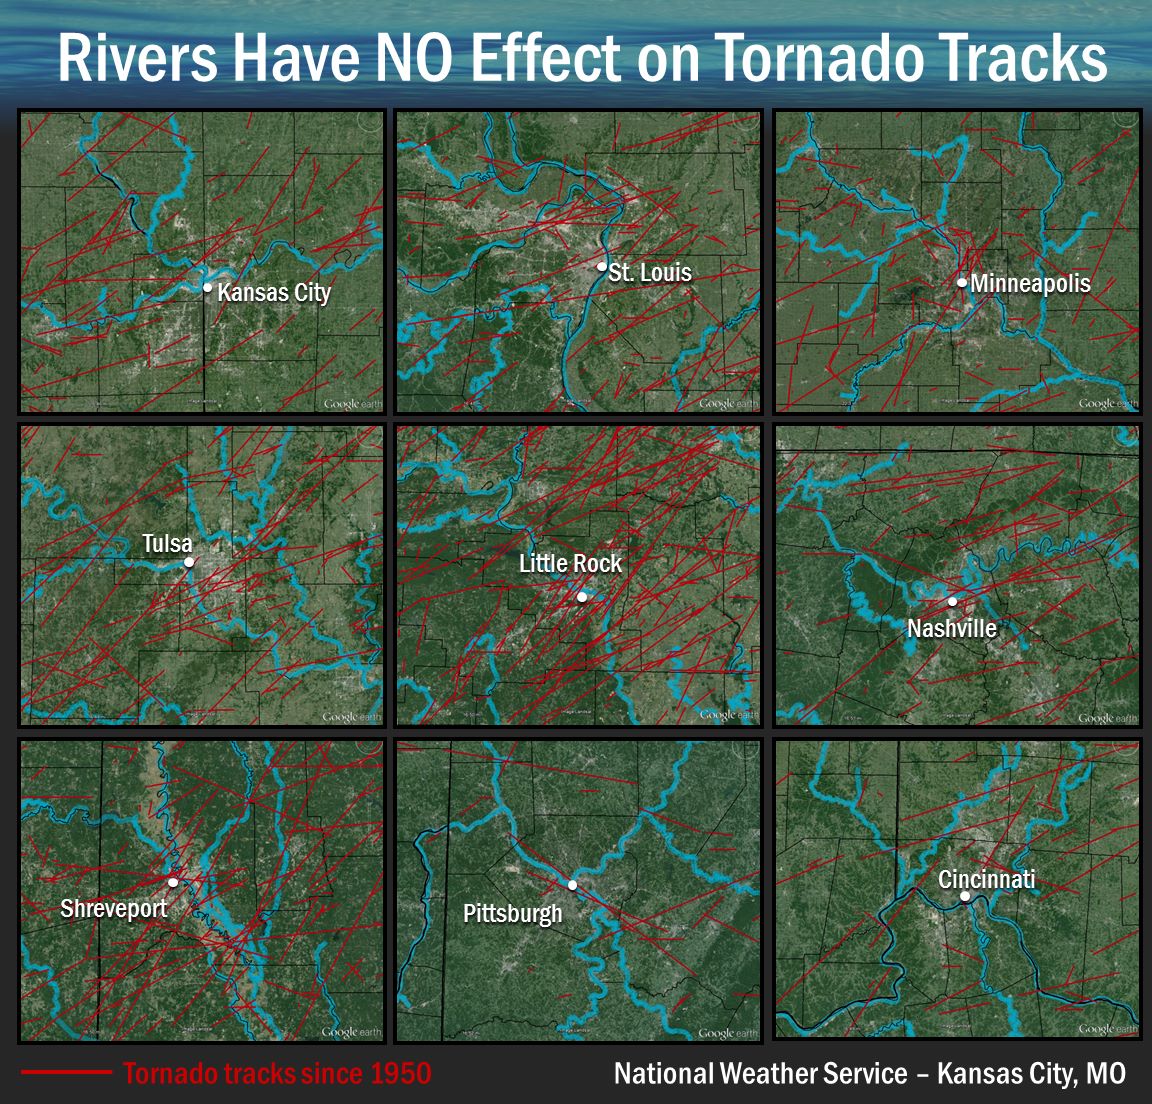
Click to enlarge.
The case for St. Louis reminded me that one of the worst tornado disasters in US history occurred when a tornado tracked through St. Louis, jumped the Mississippi River, and continued doing damage in East St. Louis. That was May 27, 1896. Besides busting the myth about rivers, it busted the myth that tornadoes do not hit major cities. At the time, St. Louis had a population close to 500,000.
The St. Louis Public Library has a great collection of photos and newspaper articles on the event. A total of 255 people were killed in both Illinois and Missouri. It was estimated to be an F-4 tornado on the Fujita scale, based on the damage seen in photographs.
Nine days after the event, a book was published based on newspaper accounts with lots of photos. It has recently been reprinted by Southern Illinois University Press and called “The Great Cyclone at St Louis and East St Louis, May 27, 1896”. Besides the incredible amount of detail on the storm’s damage, you are treated to some vivid and lurid prose (which was the newspaper style of the day).
Example of the damage from the 1896 event.
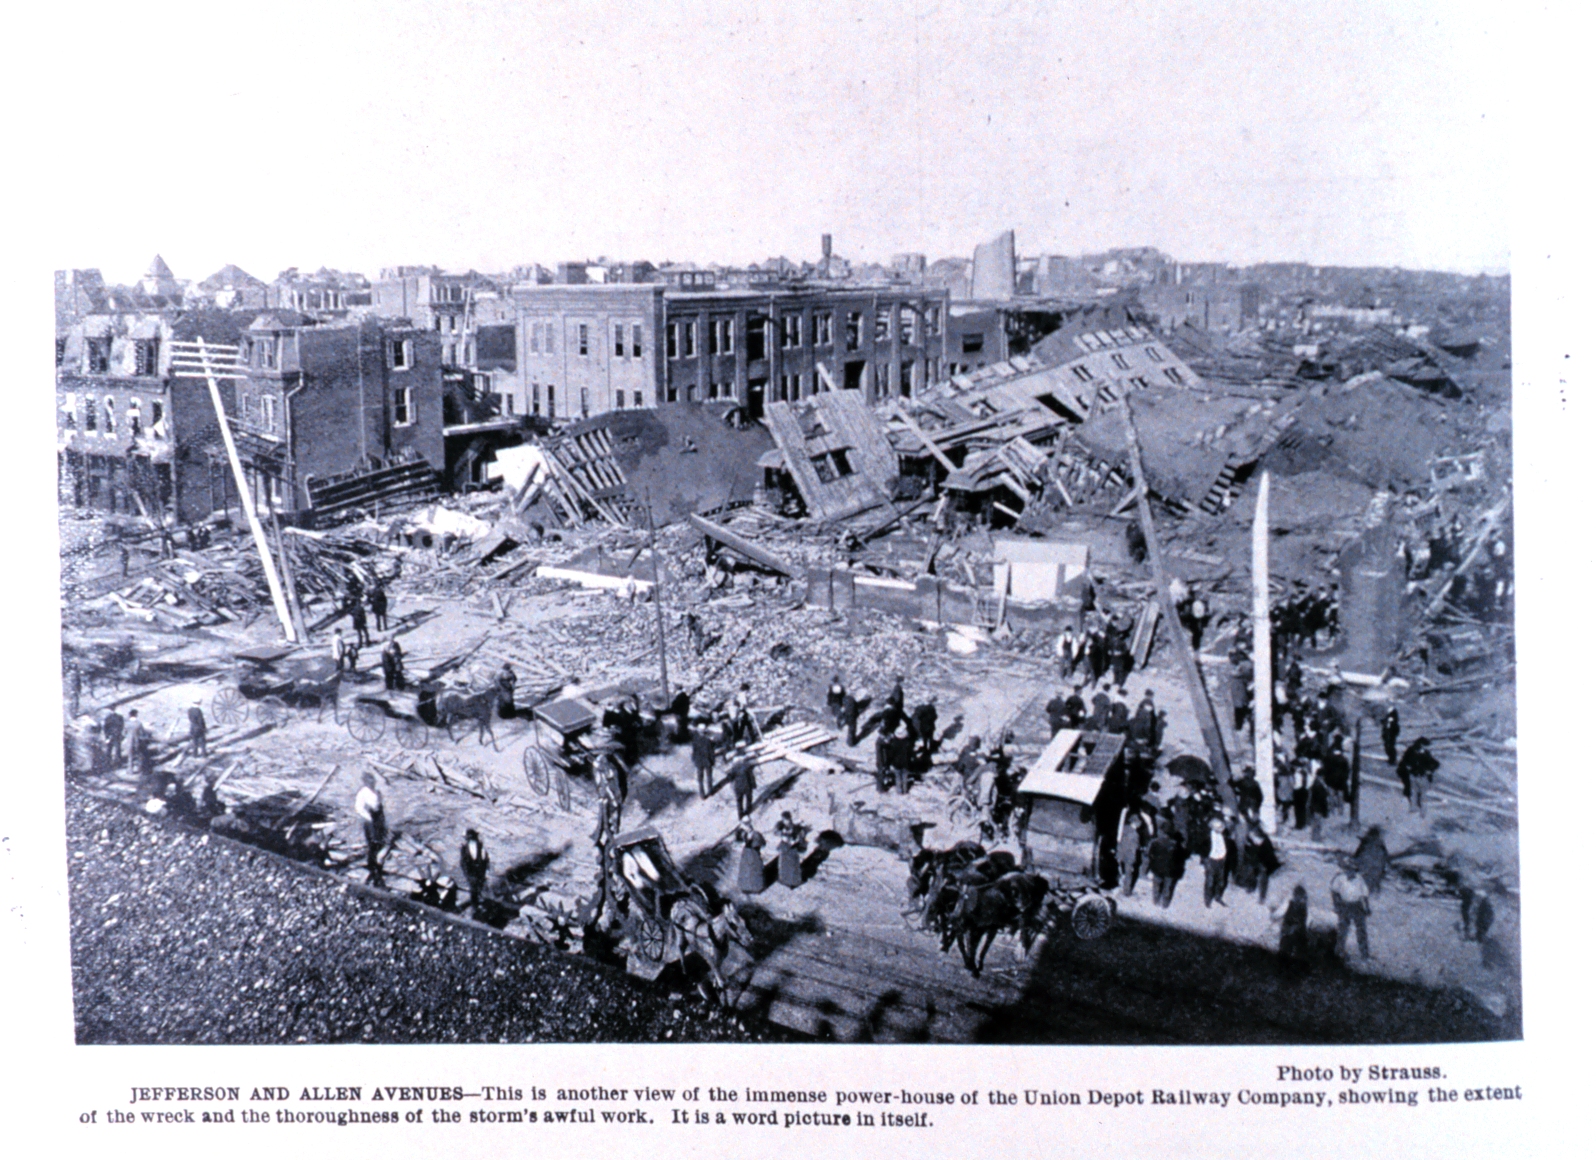
Click to enlarge. “St Louis Jefferson-Allen Damage” by http://www.photolib.noaa.gov/historic/nws/wea00256.htm “Photo by Strauss”. Licensed under Public Domain via Wikimedia Commons – http://commons.wikimedia.org/wiki/File:St_Louis_Jefferson-Allen_Damage.jpg#/media/File:St_Louis_Jefferson-Allen_Damage.jpg
I am a little late in posting this, but March 18, 2015, marked the 90th anniversary of the Tri-State Tornado that struck Missouri, Illinois, and Indiana, on March 18, 1925 (map below).
This was the deadliest tornado in U.S. history with 695 lives lost and occurred long before there were systematic forecasts and warnings of tornadoes. While it predated the common F-scale used to measure tornadoes, it was considered by experts to be an F-5 event. A few years ago there was a push to decide if this was one continuous track or not by examining all the evidence and interviewing survivors. It was hard to decide since there was no weather radar to track the storm. Some of the areas were very sparsely populated, leaving little documentation on the possible track.
Figure from Wilson, John W., and Stanley A. Changnon, Jr. (1971). Illinois Tornadoes. Circular 103. Illinois State Water Survey: Urbana-Champaign, IL.