Warm, Dry December Concludes a Cold, Wet Year

December temperatures were well above the long-term average across the state, breaking dozens of local daily maximum and minimum temperature records. The preliminary statewide December average temperature was 35.2 degrees, about 5 degrees above the 1981-2010 normal and the 18th warmest on record. Preliminary data show December was drier than average for most of the state. The statewide average December precipitation total was 2.03 inches, 0.66 inches below the 30-year normal.

Data are provisional and may change slightly over time

Warm Weather

Temperatures during the first half of December were very close to average. This was followed by a brief period of well below average temperatures caused by cold air incursion from the north on the back of a strong upper atmosphere trough to our west. On December 20 the predominant wind direction changed to southwesterly, bringing warm, dry air into the region. Temperatures between December 20 and 29 ranged from 5 to 25 degrees above normal across the state. In total, 104 daily high maximum temperature records and 27 daily high minimum temperature records were broken over this time period, including a few dozen records on December 25. In fact, it was the warmest Christmas day at 68 stations across the state. As shown in the figure below, the daily average temperature in Decatur in Macon County on Christmas was nearly 20 degrees above the 30-year normal.

The station in Elgin (Kane County) broke its previous Christmas day high maximum record by 10 degrees. The highest temperature recorded in the state was 70 degrees on December 26 in Wayne County and again on December 29 in Pope County. The lowest temperature was -4 degrees on December 15 in Rock Island County.

A shift in the upper atmosphere and the passage of a cold front late in the month allowed temperatures to moderate. December average temperatures ranged from the low 30s in northern Illinois to the mid-40s in southern Illinois. Monthly average temperature departures ranged from 7 degrees above the long-term mean in northwestern Illinois to just over 1 degree above average in south-central Illinois.

The preliminary 2019 statewide average December temperature was 35.2 degrees, which was the 18th warmest December on record. December’s warm weather was an aberration in an otherwise colder than average 2019 in Illinois. Only three months this year–July, September, and December–exhibited a statewide average temperature above the 30-year normal.

Precipitation

December precipitation was below the long-term average for the entire state. Areas in far southern Illinois received 2 to 3 inches less than average in December, approximately 50 percent of normal December precipitation. The statewide average total December precipitation was 2.03 inches, approximately 0.66 inches below normal. This last month was the 50th driest December on record in Illinois and marked the second straight month of below average statewide precipitation. Preexisting wetness and reduced evaporative demand, typical for this time of the year, have prevented impacts from the prolonged dry conditions. Despite two straight months of well below average precipitation, streamflow and soil moisture were both near normal across the state.

Snowfall totals this last month ranged from less than a tenth of an inch in far southern Illinois to over 10 inches in south-central Illinois. A strong system came through in mid-December and brought several inches of snow to an area spanning the St. Louis Metro East to the Champaign-Urbana area. The highest 24-hour snowfall total was 5.6 inches in Lovington (Moultrie County) on December 17, although CoCoRaHS observers in Mascoutah in St. Clair County and Columbia in Monroe County both recorded 7.5 inches on December 17.

The December snowfall glut in south-central Illinois turned into snowfall deficits of 8 to 10 inches in northern Illinois. This last month was only the 10th December with 1 inch or less of snowfall in Stockton (Jo Daviess County). Despite the small snowfall totals this last month, the seasonal total snowfall was above average for most of the state between interstates 80 and 64. A broad area between Peoria and the St. Louis metro east received over 4 inches of above average snowfall, whereas the Chicagoland region has so far this season experienced a snowfall deficit of 4 to 6 inches.

Outlooks

Short-term 8-14-day outlooks from the NOAA Climate Prediction Center show strongly elevated odds of both above normal precipitation and above normal temperature.

Thirty-day outlooks show elevated odds of wetter and warmer than normal conditions to persist throughout January in southern Illinois. Outlooks for January through March and March through May continue to show elevated odds of above normal precipitation for the entire state.

October: Heat to Snow

We saw highly variable temperatures across the state this month, with record-breaking heat in the early part of October, and record-breaking cold in the latter part. The preliminary statewide October average temperature was 53.7 degrees, less than 1 degree below our 30-year normal. Temperatures were near normal in eastern Illinois, and between 2 and 6 degrees below normal across western Illinois. Preliminary data suggest October was considerably wetter than normal for the entire state. The statewide average October precipitation total was 5.20 inches, approximately 2 inches above the 30-year normal. The wet deviations were particularly large in the northern and southern reaches of the state.

Data are provisional and may change slightly over time

Temperature Variability

Record-breaking high temperatures persisted from September into early October. Average temperatures during the first four days of October were 10 to 14 degrees above normal in the southeast part of the state, and 3 to 8 degrees above normal for the northwest part (see map below). Maximum temperatures broke 90 degrees and minimum temperatures remained in the 70s for several days in southern Illinois. Stations in Saint Clair and White Counties reached 96 degrees on October 2.  Between October 1 and October 4, 46 daily high maximum temperature records and 73 daily high minimum temperature records were broken across Illinois, according to the NOAA National Centers for Environmental Information (NCEI). Additionally, 9 stations broke their all-time October high maximum temperature records, and 13 stations broke their all-time October high minimum temperature records. In one particularly extreme event, the October 1 nighttime minimum temperature at Kaskaskia Lock and Dam in Randolph County was 72 degrees, 10 degrees above the previous daily record and 2 degrees above the all-time October minimum temperature record at that station.

Seasonable temperatures ensued after the heat was broken toward the end of the first week of October. Temperatures from October 5 to October 27 were near normal in eastern Illinois and between 3 and 6 degrees below normal for western Illinois (see map below). Nearly all the state experienced the first fall frost event in the second week of October. Nighttime minimum temperatures dipped below 32 degrees as far south as Pope County and below 28 degrees in Warren and Jo Daviess Counties.

The heat wave that started the month was matched by a strong burst of cold air to close out the month. Temperatures between October 28 and October 31 were 8 to 16 degrees below normal. Similarly, 48 daily low maximum temperature records and 12 daily low minimum temperature records were broken across Illinois over the last four days of the month. Nighttime minimum temperatures dropped below 30 degrees as far south as Pulaski County. The lowest minimum temperature observed in October was 14 degrees in both Carroll and Lee Counties on Halloween night. Halloween was also the coldest on record for 51 stations across Illinois.

The temperature contrast between the start and end of this month may be best summarized in the graph below, which shows daily maximum and minimum temperatures at Springfield Abraham Lincoln Capital Airport this last month. There was a 57° difference between daily maximum temperatures on October 1st and October 31st in Springfield, both of which broke daily records. In fact, 10 Illinois COOP stations broke their daily high maximum temperature record on October 1st and their daily low maximum temperature record on October 31st.

Precipitation

October precipitation was above normal for virtually all of Illinois. The statewide total precipitation in October was 5.20 inches, approximately 2 inches more than the 30-year normal. Areas of far northern and southern Illinois received over 7 inches of rainfall in October. CoCoRaHS observers in New Lenox in Will County and Riverwoods in Lake County recorded over 12 inches of precipitation in October. Expressed as a percent of the long-term mean, areas of northeastern Illinois received more than 200 percent of mean October precipitation, and a broad swath of southern Illinois received over 150 percent of mean October precipitation (see maps below). Significant rainfall helped improve drought conditions in southern Illinois. The latest U.S. Drought Monitor map – current as of October 29 – shows no drought in Illinois for the first time since early August.

The cool down that came at the end of this month brought a variety of precipitation, including snowfall and some snow accumulation in northern and western Illinois. Total snowfall accumulation over the last week of October ranged from over 8 inches in northwestern Illinois to just over a tenth of an inch as far south as Nokomis in Montgomery County. The highest October snowfall total, 8.5 inches, was in Orangeville in Stephenson County. Although late October is early for the first snowfall in Illinois, it is certainly precedented. The map below shows the date of the earliest recorded snowfall (> 0.1 inch) at COOP stations across the state.

Short- and Long-Term Outlooks

Short-term 8- to 14-day outlooks from the Climate Prediction Center show strongly elevated odds of below normal temperatures persisting into the first couple of weeks of November. Concurrently, probabilities are elevated for below normal precipitation out to 14 days, as drier weather is likely to prevail following the first winter storm of the season in Illinois.

Longer-term outlooks for November also show increased odds of below normal temperatures and increased odds of above below normal precipitation. Winter (December–February) outlooks show greater odds of a wetter than normal winter.


April 2019: An Active Weather Pattern and Late Season Snow!

April 2019 will be a month remembered for a continuation of an active and stormy weather pattern across Illinois, with two short lived, yet notable and uncommon late season snow events which impacted many in northern portions of the state.

The month finished noticeably wetter than average, with temperatures marginally below the long-term average. The preliminary average statewide April temperature was 52.0°F, which is 0.6°F below the long term average. The preliminary average statewide precipitation was 4.58 inches, which is 0.80 inches above the long term average.

Note: Data are provisional and may change slightly over time.

Precipitation

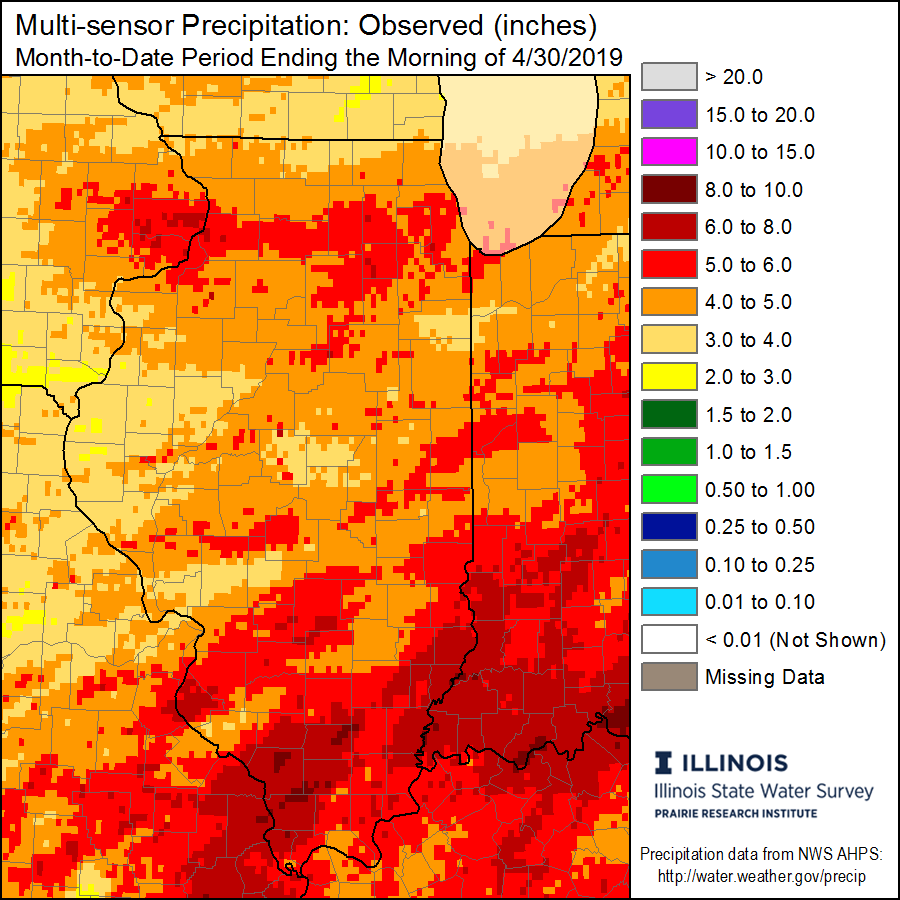
Preliminary statewide average precipitation for April was 4.58 inches, which is 0.80 inches above the long term average.

Precipitation in Illinois has been above average since December 2018. Preliminary data would rank this as the 7th wettest December – April period in state history. The end of April 2019 marked six months since any portion of the state has been classified as in drought, or abnormally dry by the U.S Drought Monitor..

An active spring weather pattern resulted in a majority of regions in northern, eastern, and southern portions of the state receiving over 100% of average monthly precipitation, with localized amounts approaching 200%.  Smaller regions of the state in west-central Illinois – roughly between the Mississippi and Illinois rivers are the only locations to receive near or below average precipitation for the month (see map below).

The heaviest precipitation fell in extreme southern Illinois, especially in counties bordering the Wabash and Mississippi Rivers, where 6 to 8+ inches were common (see map below).  The highest total in the state was reported at a station near Cobden (Union County) with 8.31 inches.

Heading into May, flooding remains an ongoing concern for the state, as soil moisture percentiles remain in the 90th to 95th percent range.
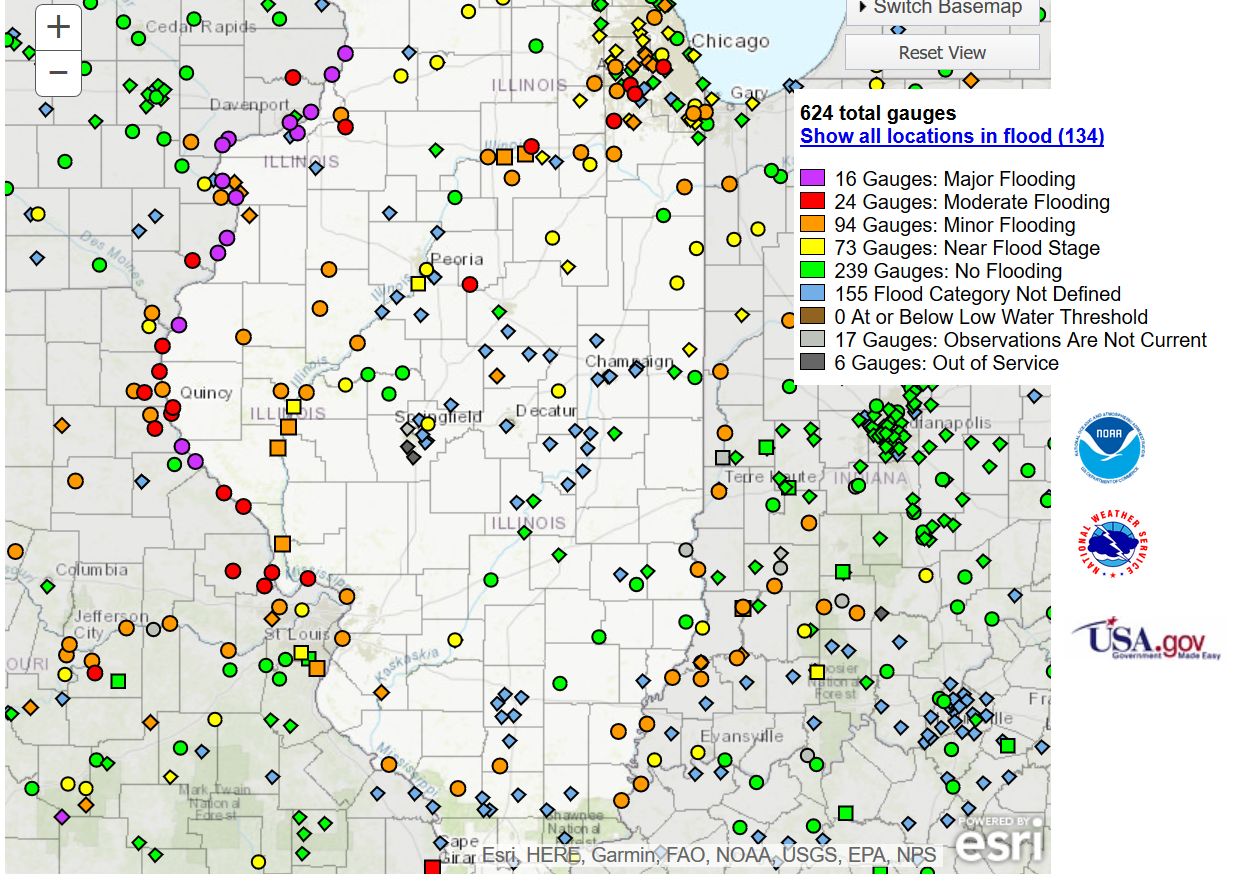
As of April 30th, 134 river gauges affecting Illinois were reported with crests in minor, moderate, or major flood stages. The greatest threat continues to remain along the Mississippi River. River flooding concerns were intensified by several days or heavy rains during the last week of April.

Snowfall

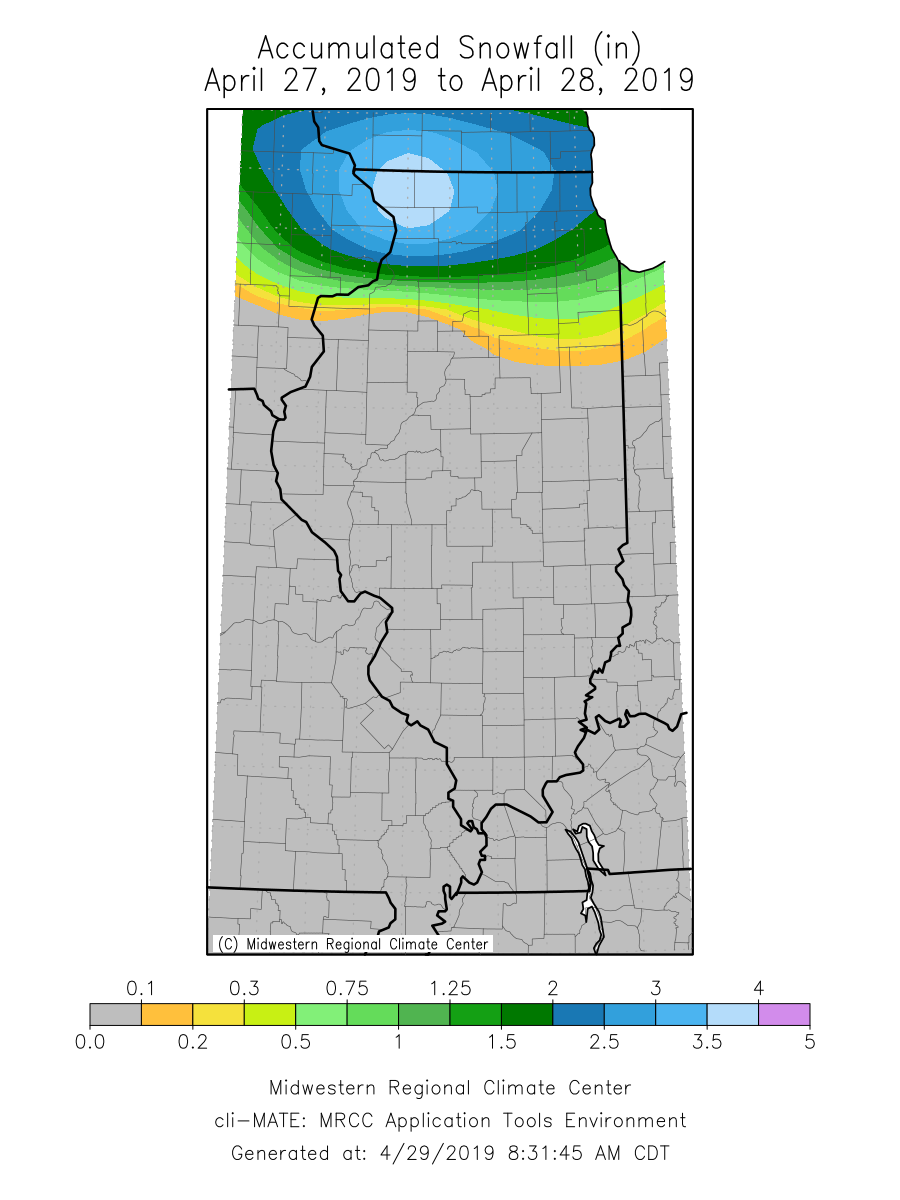
A majority of April snowfall came from two short lived, yet notable late season events that impacted many in northern portions of the state.

The first event on the weekend of April 13th and 14th brought widespread reports of 1 to 5 inches along a corridor extending from near Quincy, and running northeast toward Chicago and the Illinois/Wisconsin border. Several localities west and north of Chicago reported 6 to 8+ inches. Notable accumulations were measured as far south as Peoria. An accumulation of 5.4 inches at Chicago O’Hare Airport tied the record for the snowiest calendar day this late in the season.  April 16, 1961 also recorded 5.4 inches of snow.

The second snow event on April 27th brought a variety of wintry precipitation types to locations in northern Illinois, including another round of accumulating snow for many from Chicago and points north and west.  With 3.7 inches, this was the latest 2+ inch snow event on record for Rockford (Winnebago County).

The maximum monthly snowfall in Illinois was reported at a station near St. Charles (Kane County) with an impressive 13.5 inches.

Temperature

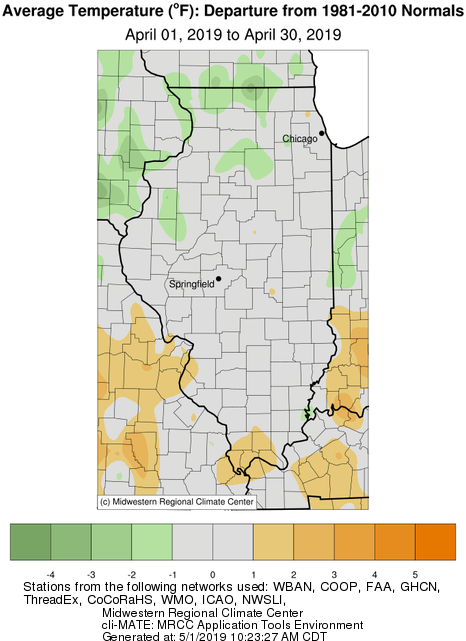
Preliminary results show that April 2019 finished with a statewide average temperature of 52.0°F which is 0.6°F below the long term average.

Despite several significant temperature swings throughout the month, which are common during springtime, statewide April temperatures finished right around the long term average. A few pockets in extreme southern Illinois reported slightly above average, and sporadic regions in northern Illinois reported slightly below the long term average.  This is a welcome change from last year,  April 2018, which ranked as the second coldest April on record.

The highest temperature in the state was recorded at a station near Jerseyville (Jersey County) with a reading of 85°F on April 23.  In contrast, the lowest temperature of 18°F was recorded at a station in Altona (Knox County) on April 1.
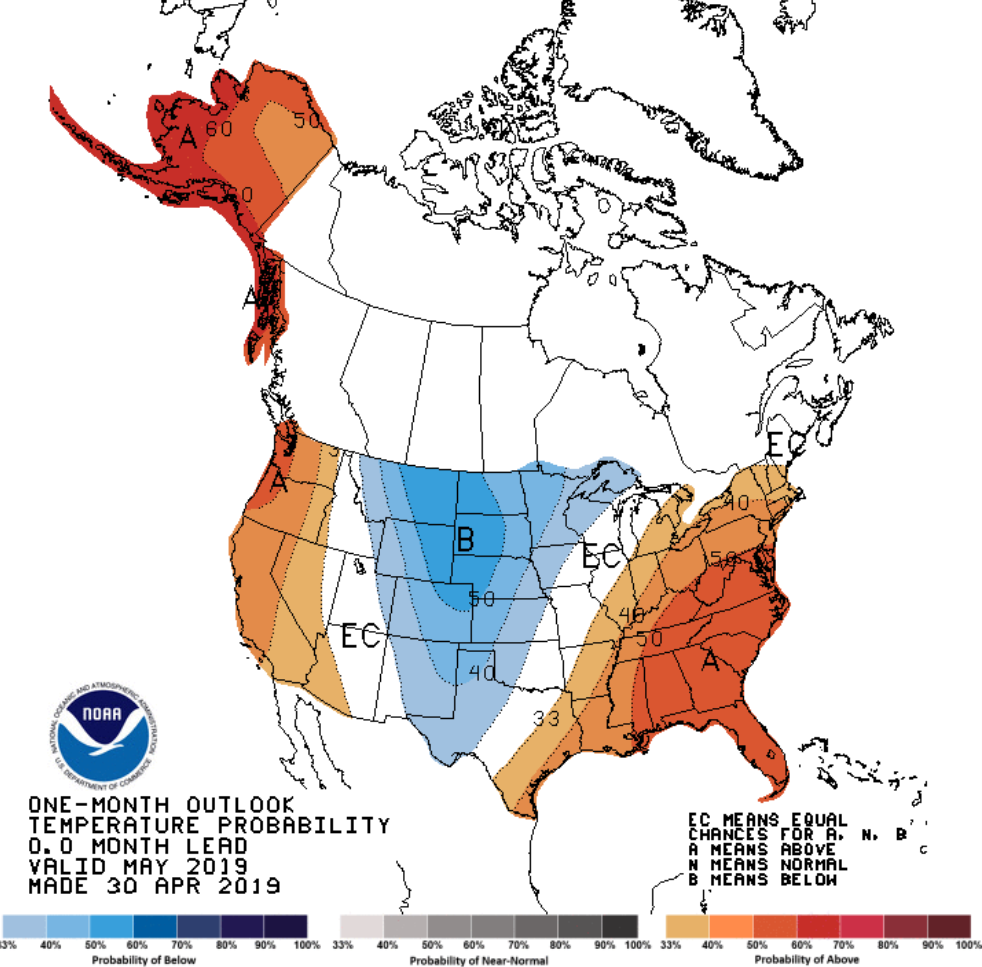
May 2019

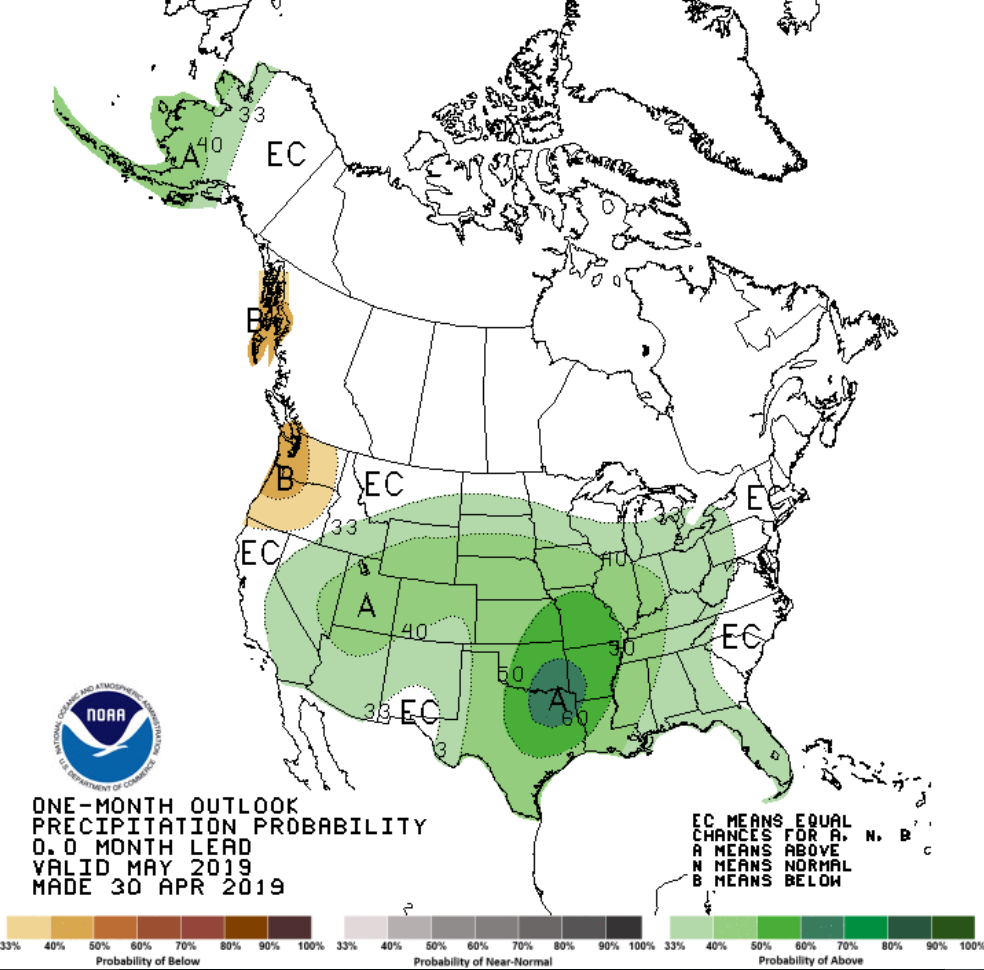
Looking ahead at the rest of May 2019, the Climate Prediction Center (CPC) is favoring probabilities of above average temperatures for the southeast half of the state, with equal chances of above, near, or below average temperatures for the northwest half of the state. Unfortunately, an active weather pattern looks to persist, as the May outlook favors probabilities of above average precipitation statewide.

Late April 2019 Snow Event

4/29/2019 – A strong and considerably cold low pressure system took aim at Illinois on Saturday April 27th, bringing a large area of widespread precipitation and unseasonably cool weather to a majority of the state.  The greatest impacts were felt in Northern Illinois, where temperatures were cold enough to support a variety of wintry precipitation types. This included a late season and uncommon accumulating snow for many from Chicago and points north and west.

According to the National Weather Service, the final snowfall total at Chicago O’Hare of 2.5 inches was the latest accumulating snowfall for the city since 1989, and the latest 2+ inch single calendar day snowfall in station history. The two day period of May 1-2, 1940 saw 2.2 inches.

Typically, Chicago O’Hare can expect 1.2 inches of snow in April, with the record for the month being 11.1 inches which was set in April 1975.  To date, April 2019 has seen 7.9 inches.

The official snowfall total in Rockford of 3.7 inches was the latest accumulating snow since 1994, and ranks as the latest 2+ inch snow event on record.  Beating out April 23, 1986 with 3.8 inches, and April 23-24, 1910 with 2.5 inches.

A station in Stockton (Jo Daviess County) reported 6.0 inches of snow with this event.  See the interpolated map below of preliminary snowfall accumulation across the state. (Note: Locally higher snowfall reports were common)

Behind this system, and with the aid of fresh spring snow cover, temperatures dropped across Northern Illinois, with Rockford tying the record daily low temperature on the morning of April 28th with a reading of 28°F.

In total 26 weather stations reported temperatures below freezing on the morning of April 28th, with Stockton (Jo Daviess County) reporting the lowest weekend reading in the state with just 21°F.