Unequal August Precipitation Leads to Drought in Illinois

August 2019 will be remembered for remarkable differences in monthly precipitation totals across Illinois, as well as the first appearance of drought in the state since September 2018.

It would be inappropriate to summarize August 2019 precipitation across the state using only one adjective. Preliminary data suggest that August was drier than average across much of the state north of I-72 and south of I-64, while much wetter than average conditions prevailed between the two interstates. The preliminary average statewide precipitation was 4.21 inches, which is 0.61 inches below the long-term August average. The preliminary average statewide August temperature was 72.8 degrees, which is 0.7 degrees below the long-term average.

Data are provisional and may change slightly over time

Precipitation & Drought

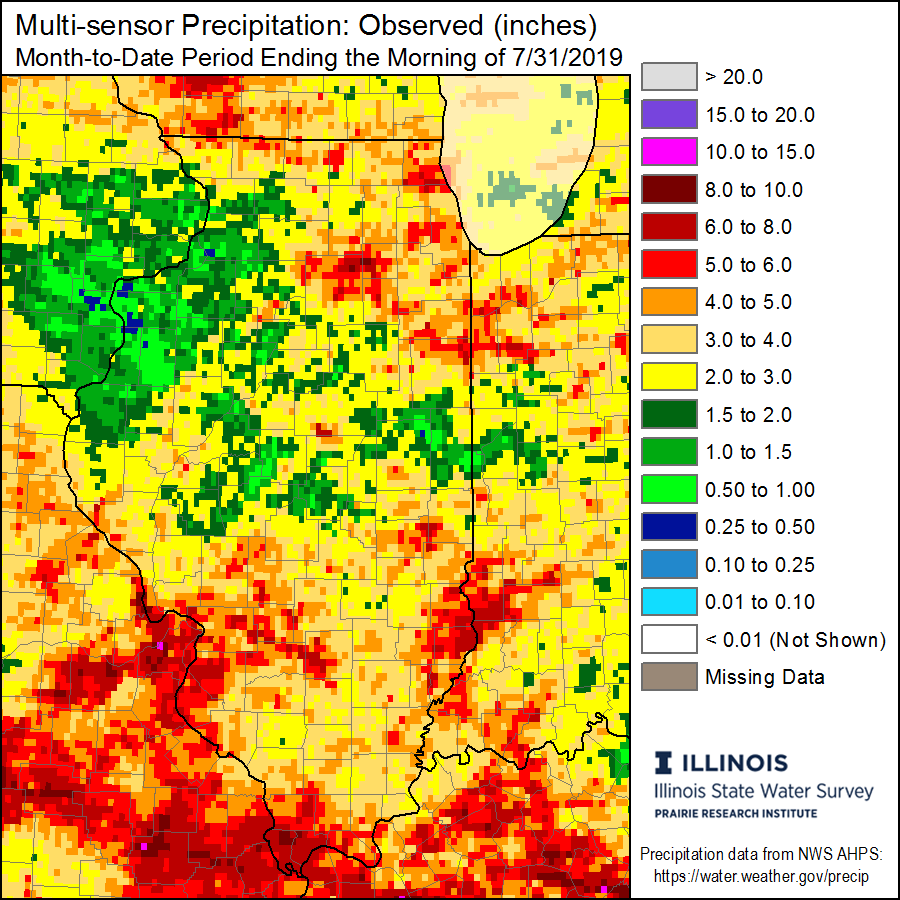
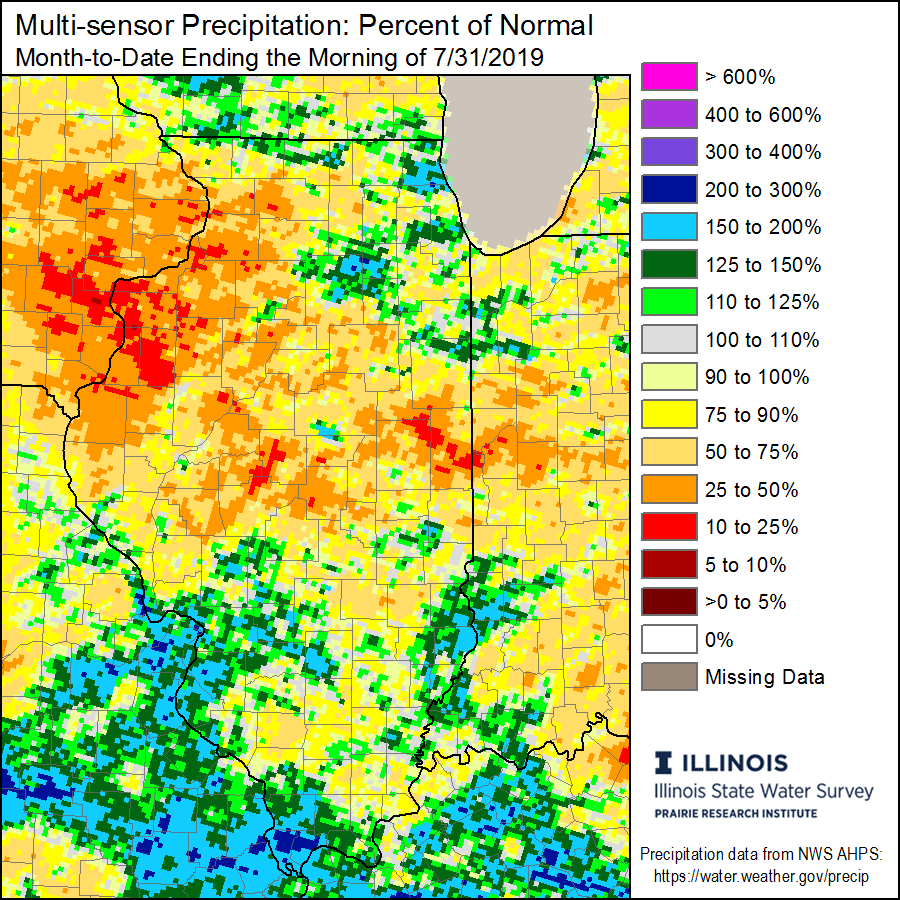
July 2019 was the first month since November 2018 that ended with below average statewide precipitation. Dryness in the northwest and east-central parts of the state that began in July persisted in August.

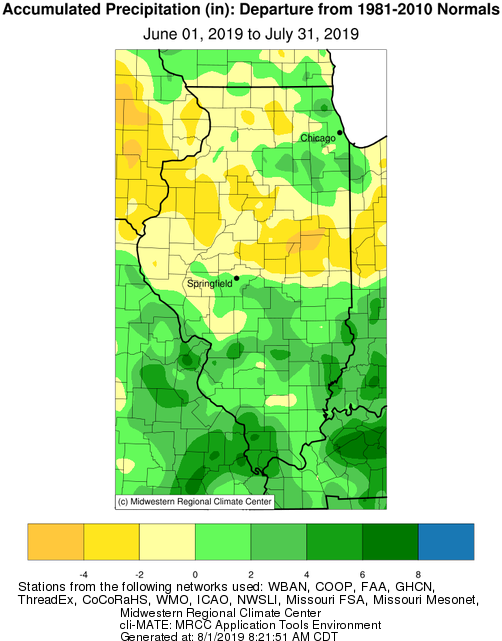
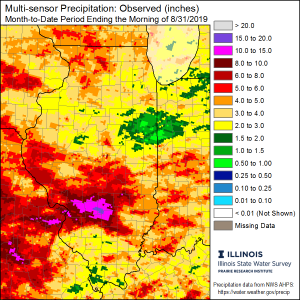
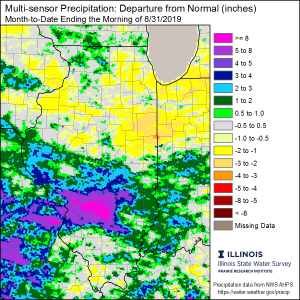
Areas in the south-central part of the state, particularly in the western extent of the St. Louis metro east, have received precipitation totals in August between 5 inches and 8 inches above normal, with a station near Patoka (Marion County) reporting the highest August rainfall total of 14.19 inches. Most areas of the state north of I-72 and south of I-64, in contrast, received below normal rainfall in August, in some cases up to 4 inches below normal. The driest area in August covered parts of Ford, Iroquois, and Vermilion counties in east-central Illinois, where precipitation totals were less than 50 percent of their August normal (see maps below).


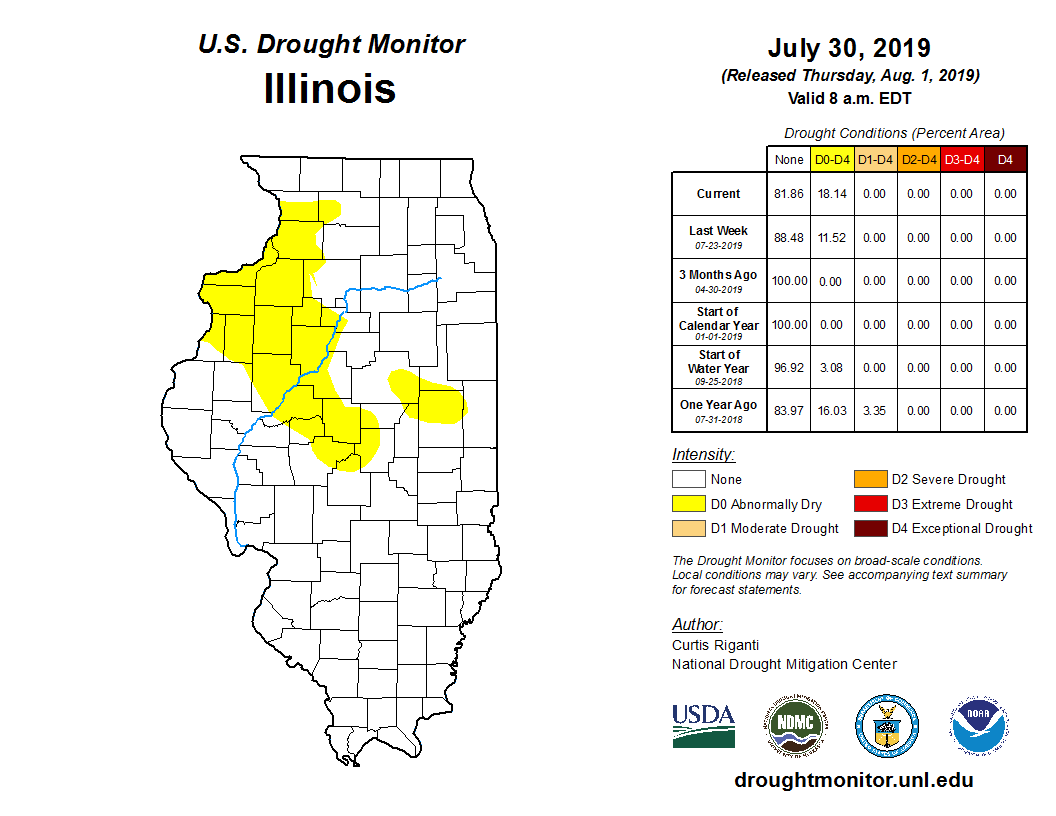
The continued dry conditions from July to August led the U.S. Drought Monitor to identify moderate drought (D1) in northwest and east-central Illinois in their August 13 map. This was the first time the Drought Monitor identified drought in Illinois since September 2018, which represents the largest number of consecutive, drought-free weeks (48) since the Drought Monitor began 20 years ago. The latest Drought Monitor map, from August 29, shows moderate drought persistence in northwest and east-central Illinois (see figure below).

The combination of late planting, due to flooding, and multi-week drought has stressed crops and farmers across central Illinois. Reports from Illinois Farm Bureau CropWatchers discuss corn dropping ears and beans dropping leaves in parts of Champaign County. The recent National Weather Service precipitation forecast calls for between 0.75 inches and 2 inches over the next 7 days for most of the northern half of the state, with little to no precipitation in southern Illinois.
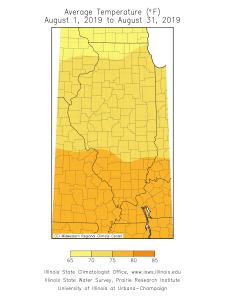
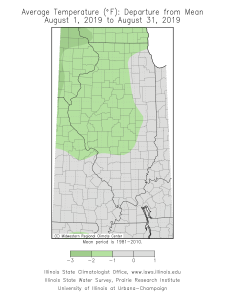
Temperature

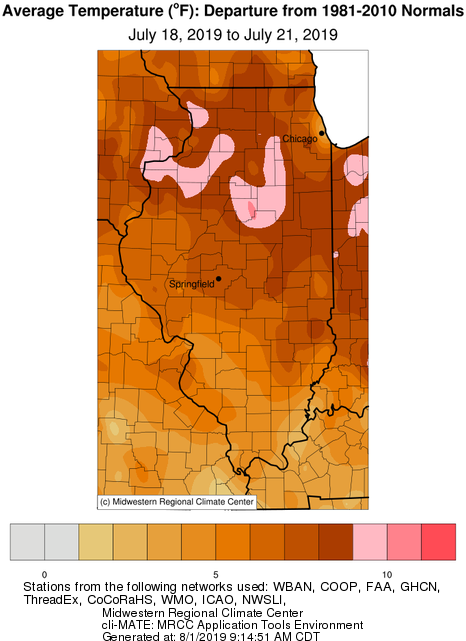
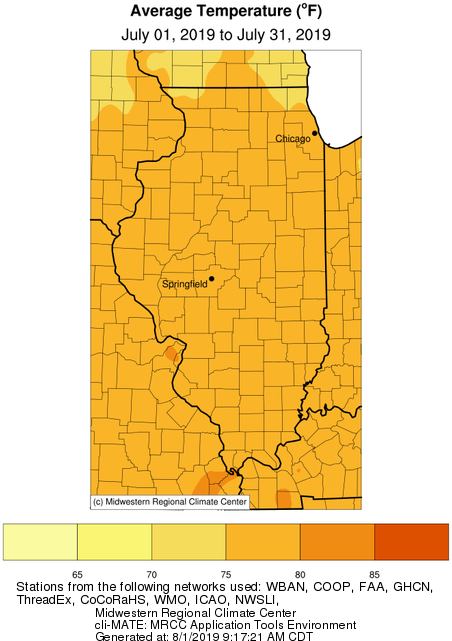
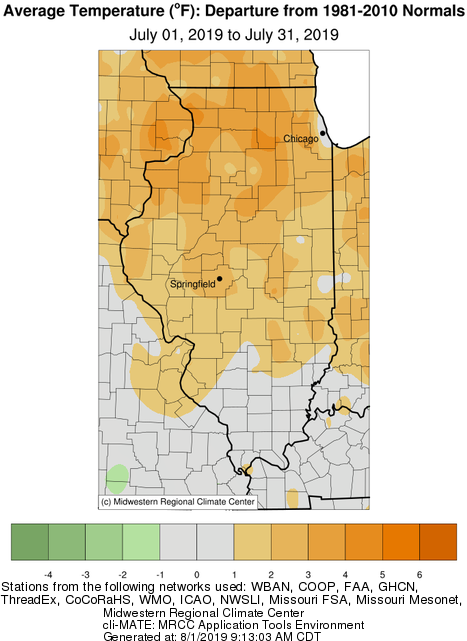
Much of the state experienced near normal to slightly below normal temperatures in August. A strong cold front in the early part of the month and the last week of the month resulted in cooler conditions, with minimum temperatures ranging from the high 40s to high 50s across the state. This was particularly the case for the northwest quadrant of Illinois. However, all of the state experienced August temperatures within 2 degrees of the long-term August mean (see maps below). August average temperatures ranged from 79 degrees in Pulaski County to 68 degrees in Jo Davies County. The lowest minimum temperature reported in Illinois in August was 48 degrees in DeKalb County on August 2nd, and the highest maximum temperature reported in Illinois was 98 degrees in Pulaski County on August 20th.

September 2019 Outlook

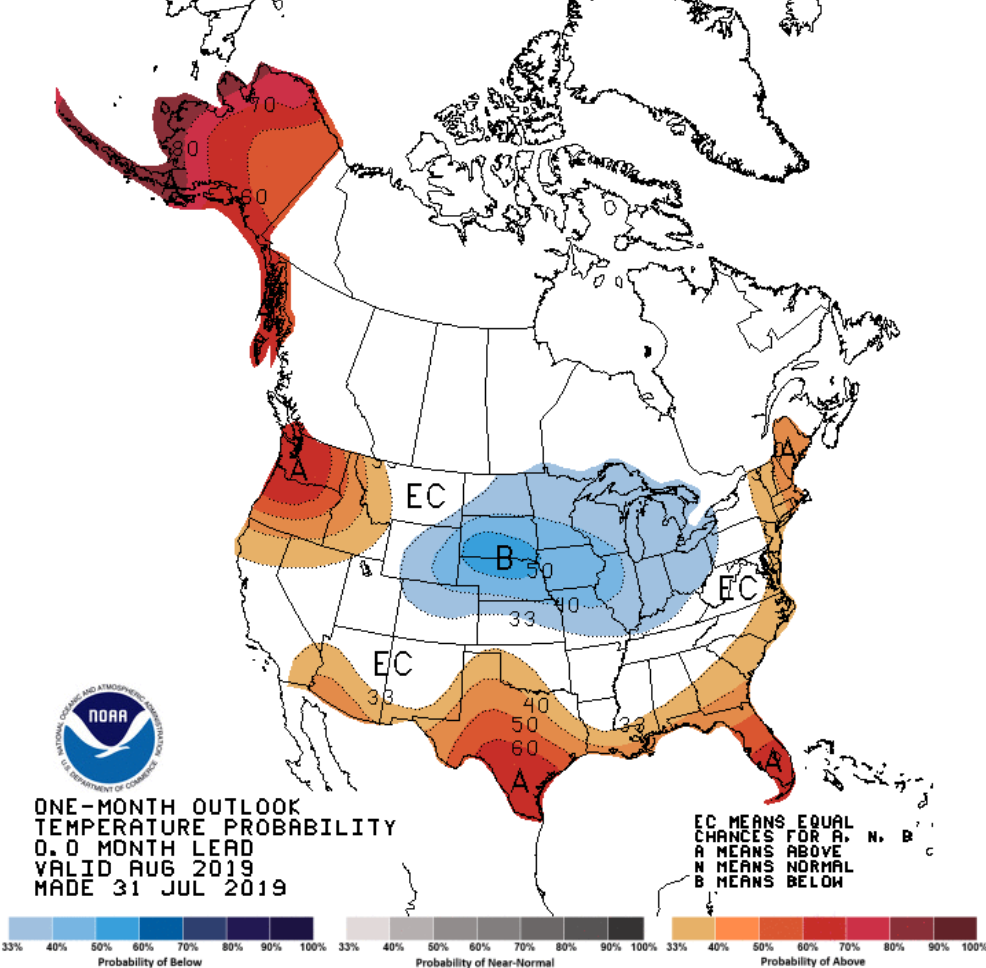
Looking into September, the monthly outlook from the Climate Prediction Center (CPC) issued on August 31 shows slightly elevated probabilities of below normal temperatures across the northern half of the state, with equal chances of above normal, normal, and below normal temperatures in the southern half.

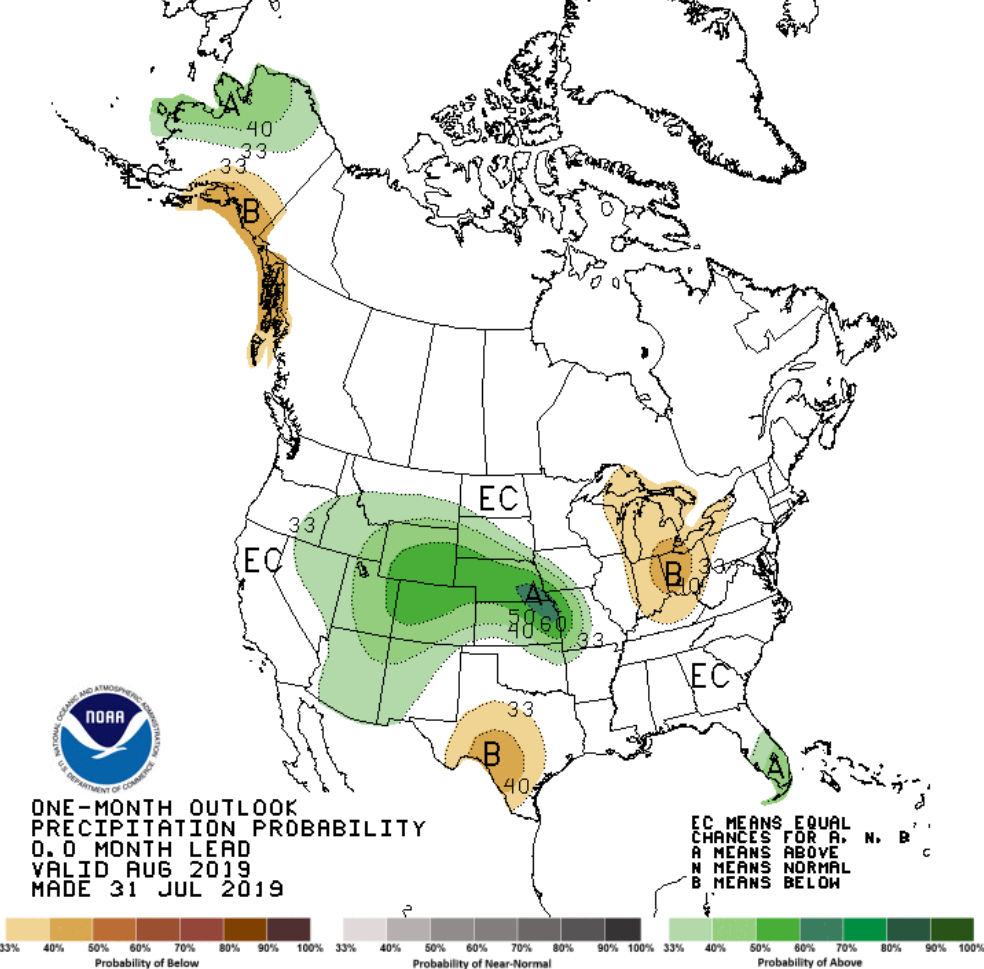
September precipitation probabilities slightly favor above normal precipitation in the northwest corner of the state, but are equal (above normal, normal, below normal) for the rest of Illinois (see maps below).

September 2019 Temperature Outlook

September 2019 Precipitation Outlook

July 2019: Prolonged stretch of abnormally wet weather comes to an end, along with notable hot and humid conditions.

July 2019 signaled the end of a persistent and historic stretch of abnormally wet conditions across Illinois, along with several notable periods of significantly above average temperatures.

Preliminary data suggest that July 2019 concluded drier than average, with temperatures above the long-term average. The preliminary average statewide July temperature was 77.3°F, which is 1.9°F above the long-term average. The preliminary average statewide precipitation was 3.23 inches, which is 0.85 inches below the long-term average.

Data are provisional and may change slightly over time

Precipitation

After seven consecutive months of above average statewide precipitation, July 2019 marked the end of the historic wet streak with below average statewide precipitation for the first time since November 2018. Despite the overall below average designation, July precipitation across Illinois was not evenly distributed.

Many in southern and northeastern portions of the state experienced near to above average precipitation totals in July, with a station near Highland (Madison County) reporting the highest monthly rainfall total of 9.02 inches. In contrast, large regions of western and central Illinois saw below average rainfall. In fact, multiple localities near the Quad Cities and along the Mississippi River, as well as smaller regions in east-central Illinois received only 10 to 25% of average monthly precipitation (see maps below).

Dating back to June 1, these same regions have reported precipitation departures of around 2 to 4+ inches below the long-term average. This extended stretch of dry conditions prompted the August 1 map from the U.S Drought Monitor (using data through July 30) to continue to highlight areas of abnormally dry conditions across the western and central portions of the state.

Illinois Precipitation Departures Map
Midwest Regional Climate Center (MRCC), accessed 8/1/2019
Illinois Drought Map
U.S Drought Monitor (UDSM) Illinois, accessed 8/1/2019

Interactive July 2019 Climate Station Precipitation Map

Temperature

Despite an overall seasonable and pleasant ending, the first weeks of July brought several extended periods of heat and humidity to Illinois. Most notable was the heat wave that impacted the region from July 18 through July 21, in which every county in Illinois was under an Excessive Heat Warning at some point during the weekend. Throughout this event, daily maximum station temperatures soared into the 90s, with dew points in the mid- to upper 70s. This resulted in heat indices over 100 for many and approached 110 or higher in some localities. Daily temperature departures of 8 to 10+ degrees above average were common across the northern half of the state (see map below).

Illinois July Heatwave Map

Overnight low temperatures during this event did not bring much, if any, relief from the heat. With a daily minimum temperature of only 80 degrees on July 19, Rockford (Winnebago County) set a new all-time record-high minimum temperature. Records for Rockford extend back to 1905.

Looking at July as a whole, the average station temperatures varied from the mid-70s to the low 80s, and monthly temperature departures of 1 to 4 degrees above the long-term average were common for the northern two-thirds of Illinois (see maps below). The highest temperature reading in the state of 98 degrees occurred at two stations, Flora (Clay County) on July 11, and Palestine (Crawford County) on July 21. The lowest minimum temperature of 51 degrees also occurred at two stations, one near Champaign (Champaign County) on July 23, and at a station near Paxton (Ford County) on July 25.

Illinois July Average Temperatures

Ilinois July Temperatuer Departures

Interactive July 2019 Climate Station Temperature Map

August 2019 Outlook

For the remainder of August, the monthly outlook from the Climate Prediction Center (CPC) issued on July 31 favors probabilities for below average temperatures across Illinois and most of the upper Midwest. The outlook also favors near equal chances for below, near, or above average precipitation.

CPC August 2019 Temperature Outlook
August 2019 Temperature Outlook
CPC August 2019 Precipitation Outlook
August 2019 Precipitation Outlook

Dryness Continues in Central Corn Belt

Summary: Rapid drying has occurred across the central Corn Belt since June 1 as virtually no rain has fallen, including most of central and northern Illinois. In addition, high water demand on soils has caused soil moisture to steadily drop in sites across Illinois. Estimates at one location in central Illinois put the water loss from evaporation in the soils and transpiration from plants at 2.4 inches since June 1.
When we get this short-term combination of little rain, high temperatures, and high evapotranspiration rates in summer months, we call it a “flash drought” because conditions can deteriorate rapidly such as they did in the 2012 drought. In my opinion, we are not quite there yet, but we could be if this continues for another few weeks.

Current Conditions and Forecast

Rainfall: Here is the map showing the dryness across the central Corn Belt since June 1. The area shaded gray has had almost no rain at all. Areas in orange have received 0.1 inches or less.
map1
Continue reading “Dryness Continues in Central Corn Belt”

Drought Monitor Says Abnormally Dry – Should We be Worried?

The US Drought Monitor introduced their D0 “abnormally dry” category across northern and western Illinois (first map). Should we be worried? We have been running about 2 to 4 inches below average on precipitation this winter (second map) – that’s both rainfall and the water content of any snow. The good news is that the demand for water is very low in winter. Therefore, the impacts on soil moisture, stream flows, and lake levels so far have been minimal.

20150127_IL_trd
Click to enlarge. http://droughtmonitor.unl.edu/

Continue reading “Drought Monitor Says Abnormally Dry – Should We be Worried?”