October was much cooler and slightly drier than average across Illinois. The preliminary statewide average October temperature was 51.8 degrees, 2.6 degrees below the 30-year normal, and tied for the 19th coolest on record. Preliminary statewide average total precipitation for August was 3.03 inches, 0.21 inches less than the 30-year normal, and the 54th wettest on record.
Data are provisional and may change slightly over time
October Temperatures
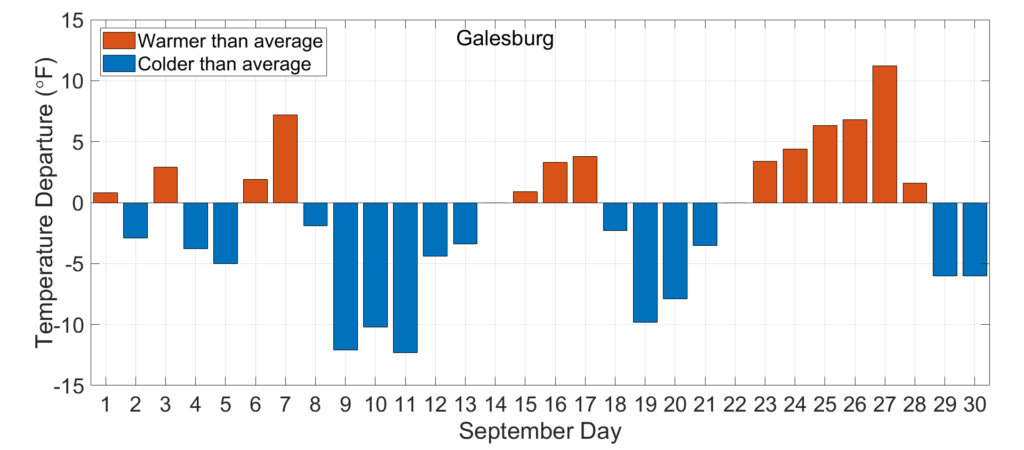
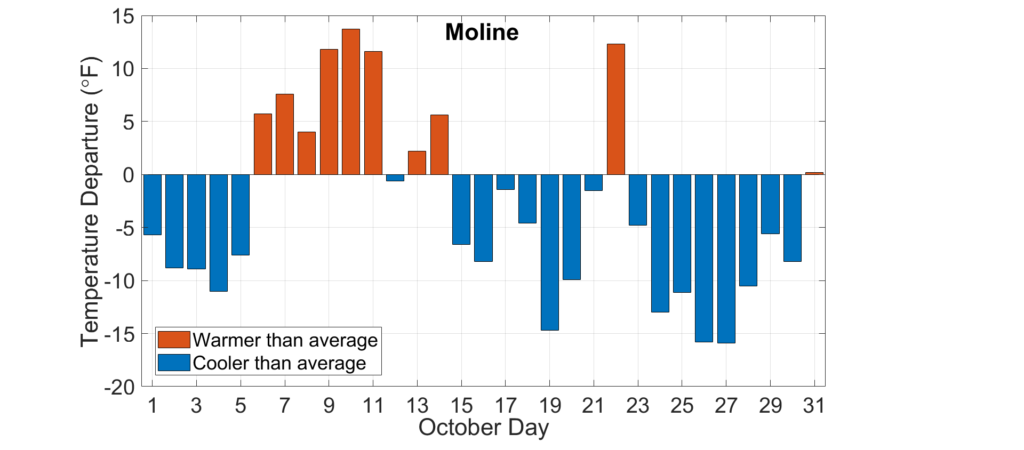
Cool weather persisted from the end of September to the first week of October across the state. As the plot below of daily temperature departures from normal in Moline shows, the second week of October was 5 to 10 degrees warmer than average across the state. However, this was followed by a predominantly cooler than average second half of the month.
Eleven daily high maximum temperature records and eight daily high minimum temperature records were broken last month. Concurrently, 66 daily low maximum temperature records and 19 daily low minimum temperature records fell in October. The cool, cloudy day of October 27 broke the month’s low maximum temperature records at seven locations in Illinois. This included the 34-degree high in Kewanee in Henry County, which broke the previous October low maximum temperature record of 36 degrees, set just last year on Halloween.
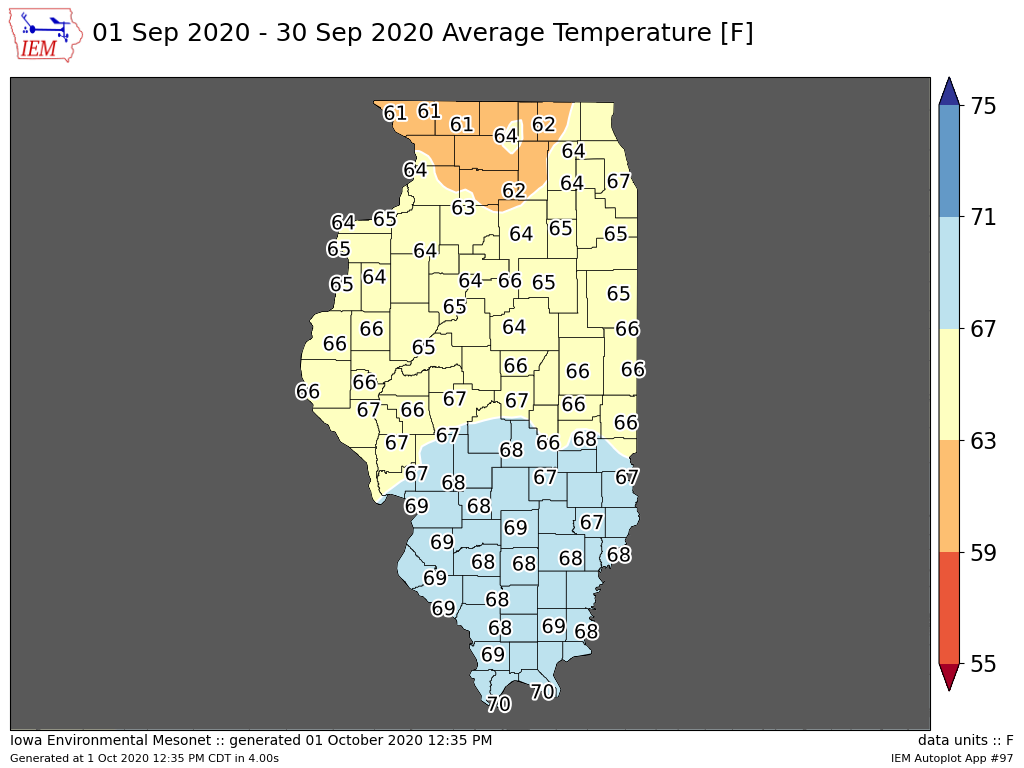
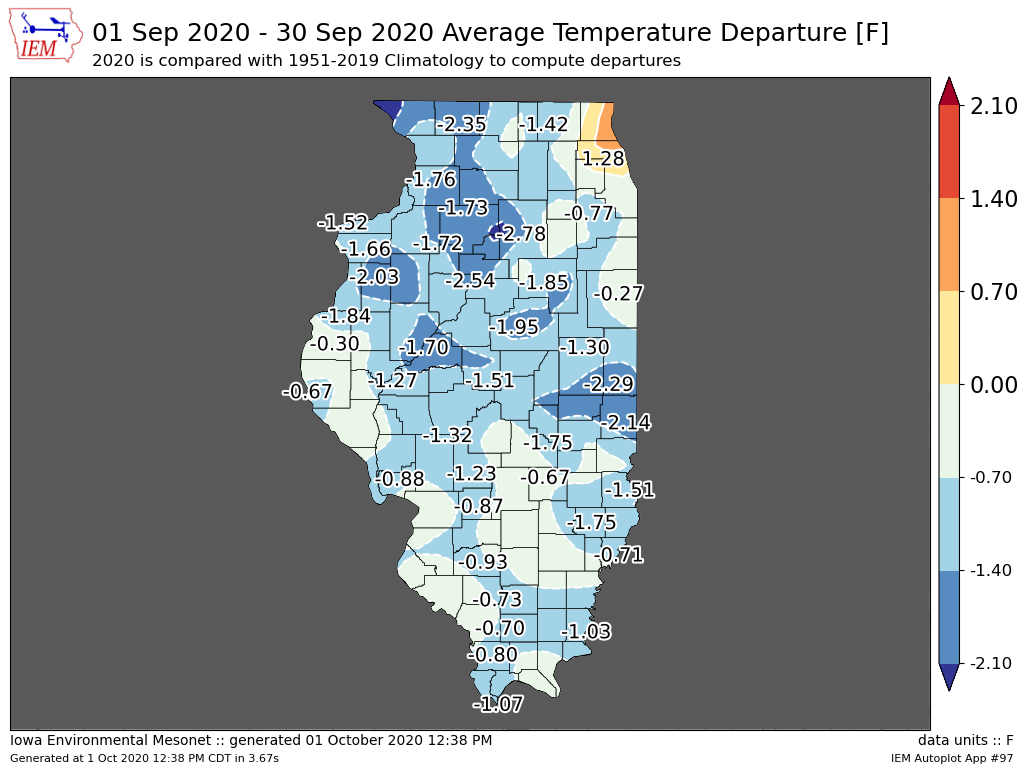
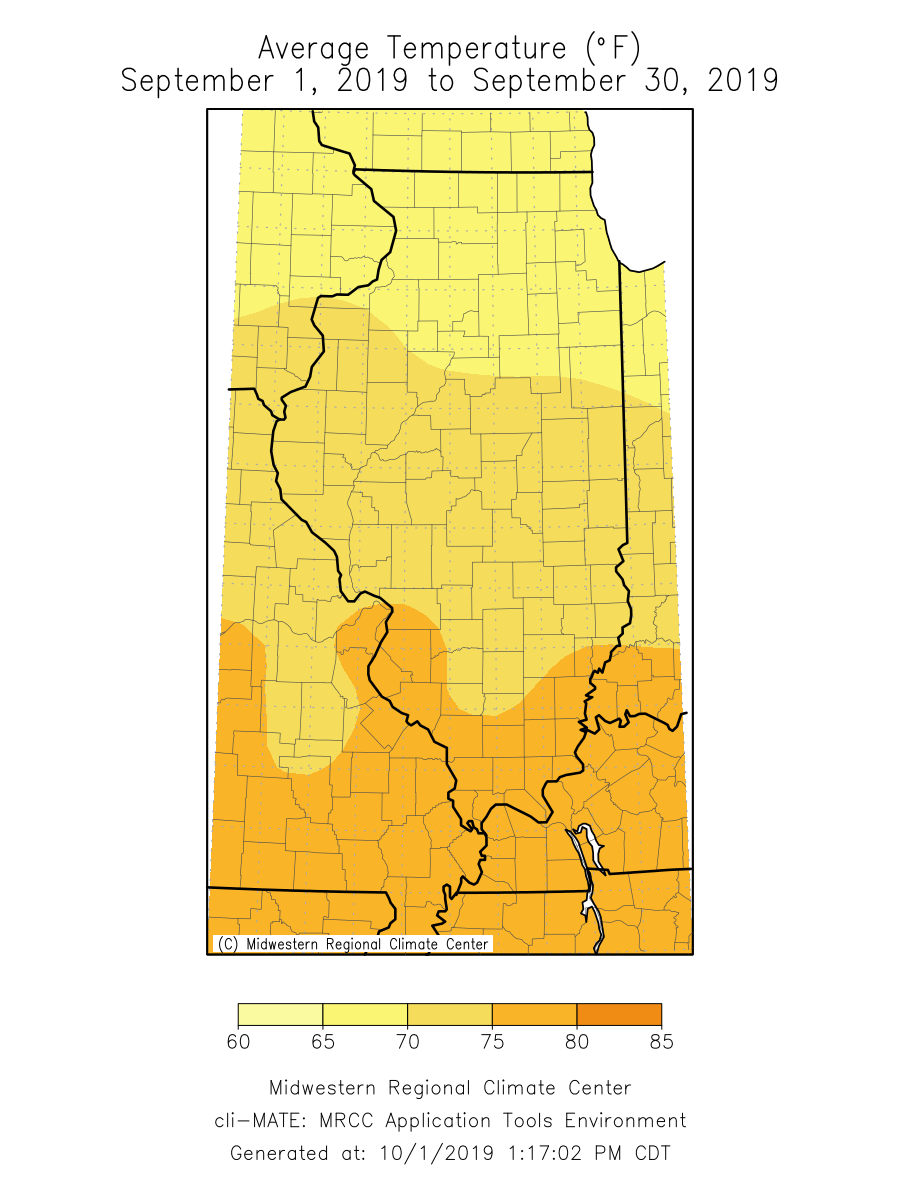
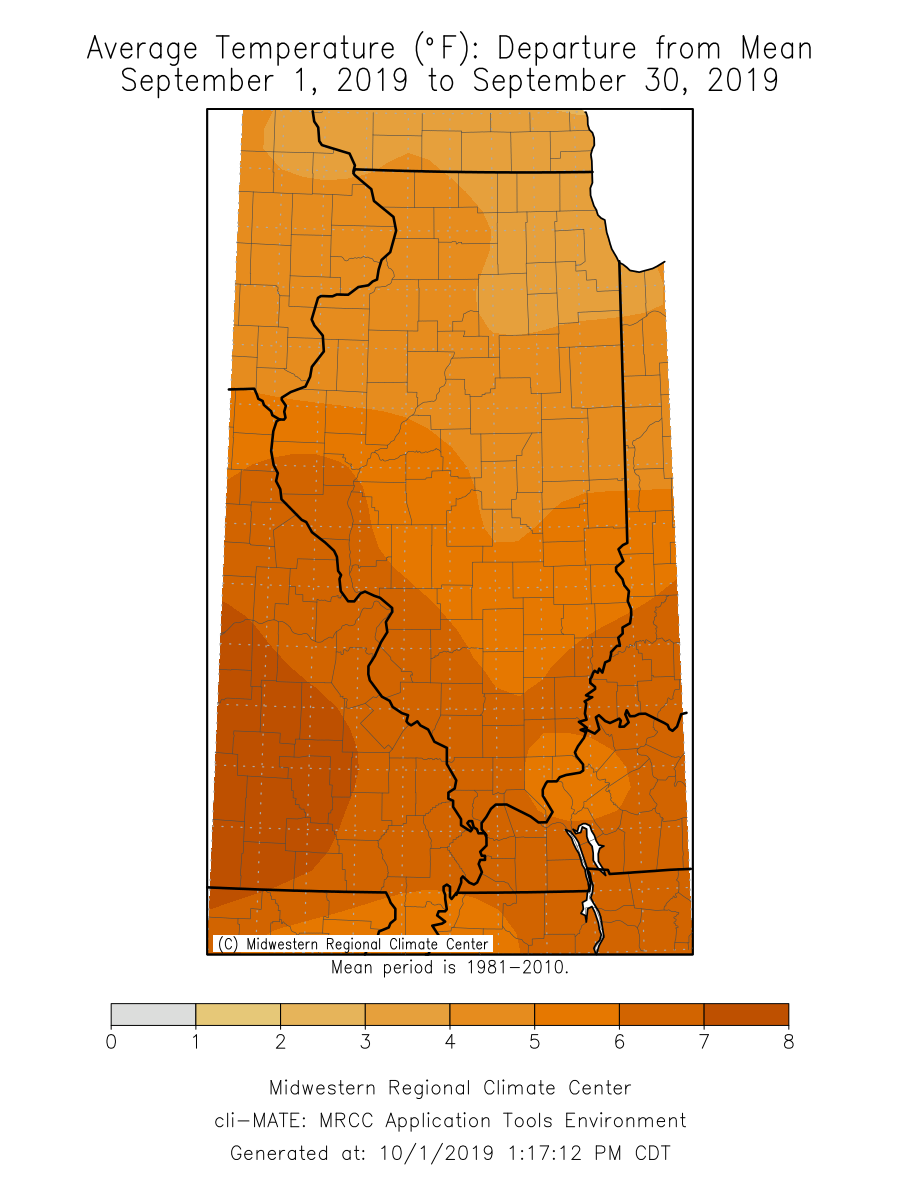
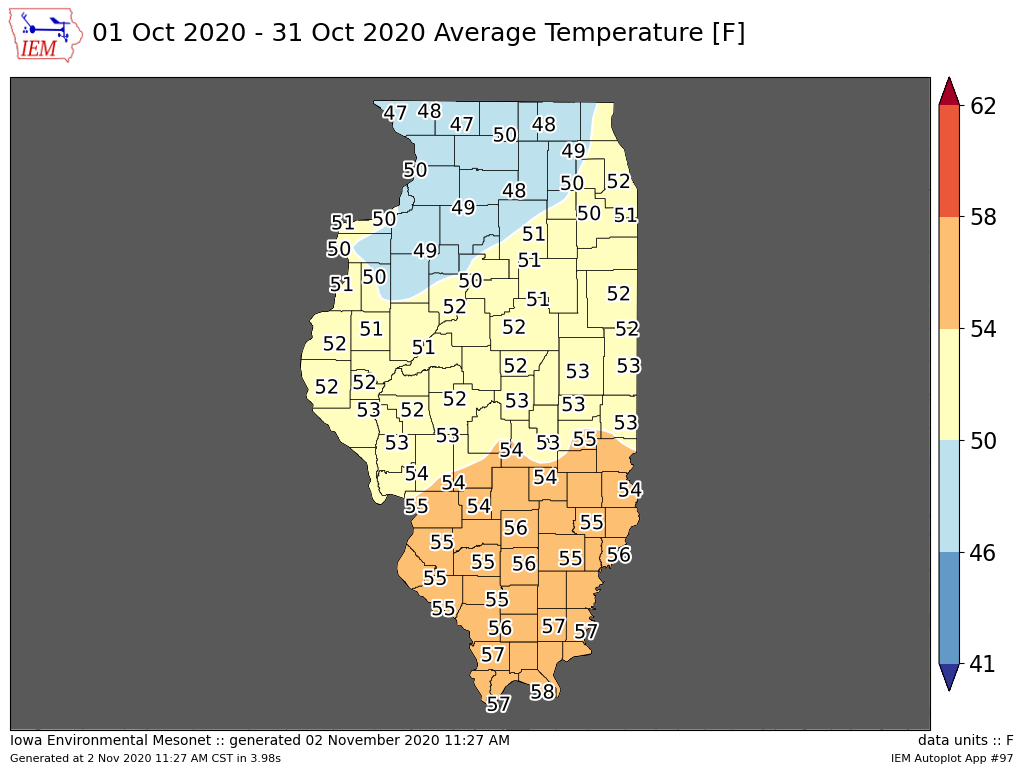
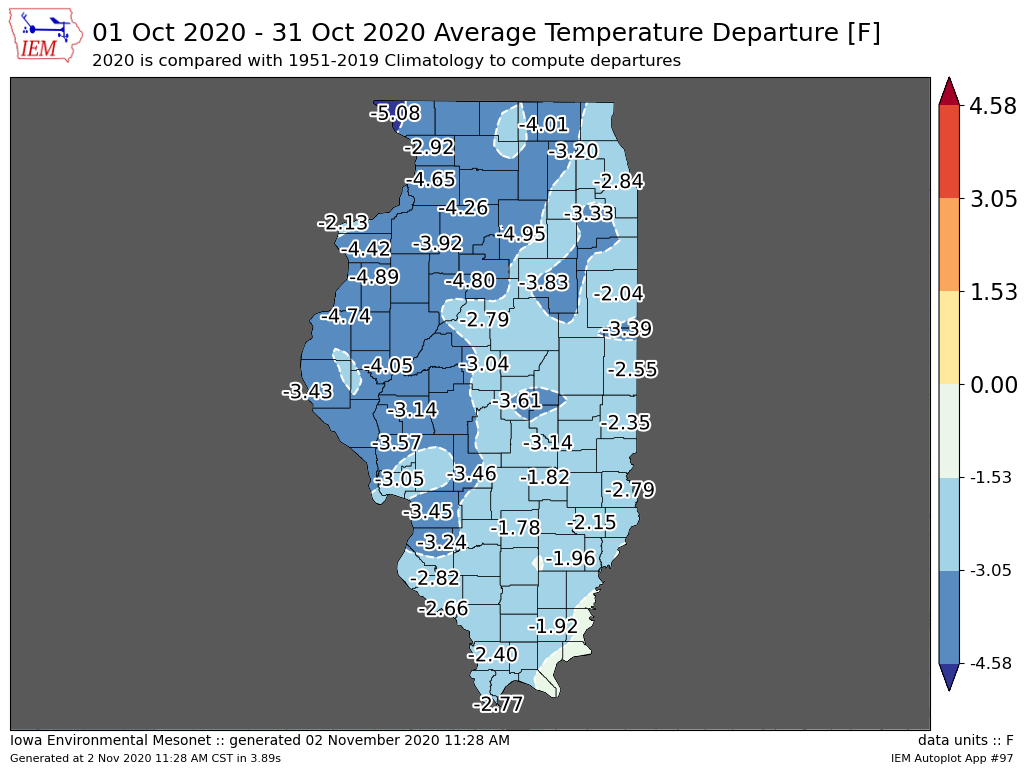
The maps below show October average temperatures and their departure from the long-term average. October average temperatures ranged from the high 40s in northwest Illinois to the high 50s in southern Illinois, between 2 and 5 degrees below average. The preliminary statewide average October temperature was 51.8 degrees, 2.6 degrees below the 30-year normal and tied for the 19th coolest on record. This follows the cooler than normal months of August and September statewide.
Harvest Fires
The combination of high temperatures, very low humidity, and strong winds created a significant fire risk during the second week of October. The plot below shows a daily mean surface vapor pressure deficit, a measure of atmospheric humidity, at Springfield between January 1 and October 18 of this year (red line) compared to all previous years (gray shaded area). A vapor pressure deficit has been linked to wildfire risk, with higher vapor pressure deficit values indicating a higher risk of wildfire outbreak.
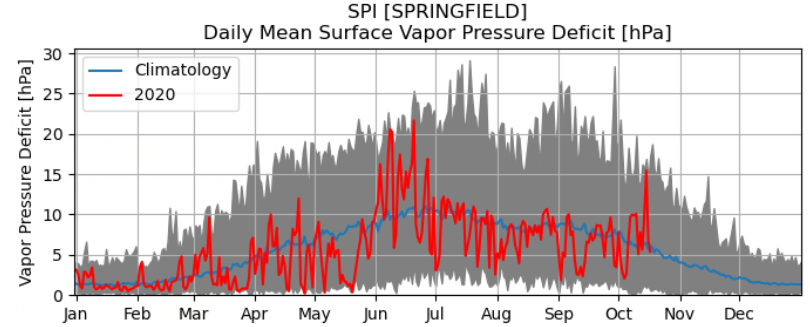
The very high values of vapor pressure deficit in Springfield, near record values on October 14, indicated a warm, dry atmosphere. Existing drought and crops drying down in fields provided ample, dry fuel for wildfire potential. Indeed, several small- to medium-sized field fires broke out across central and south-central Illinois during the second week of October.
First Snow of the Season
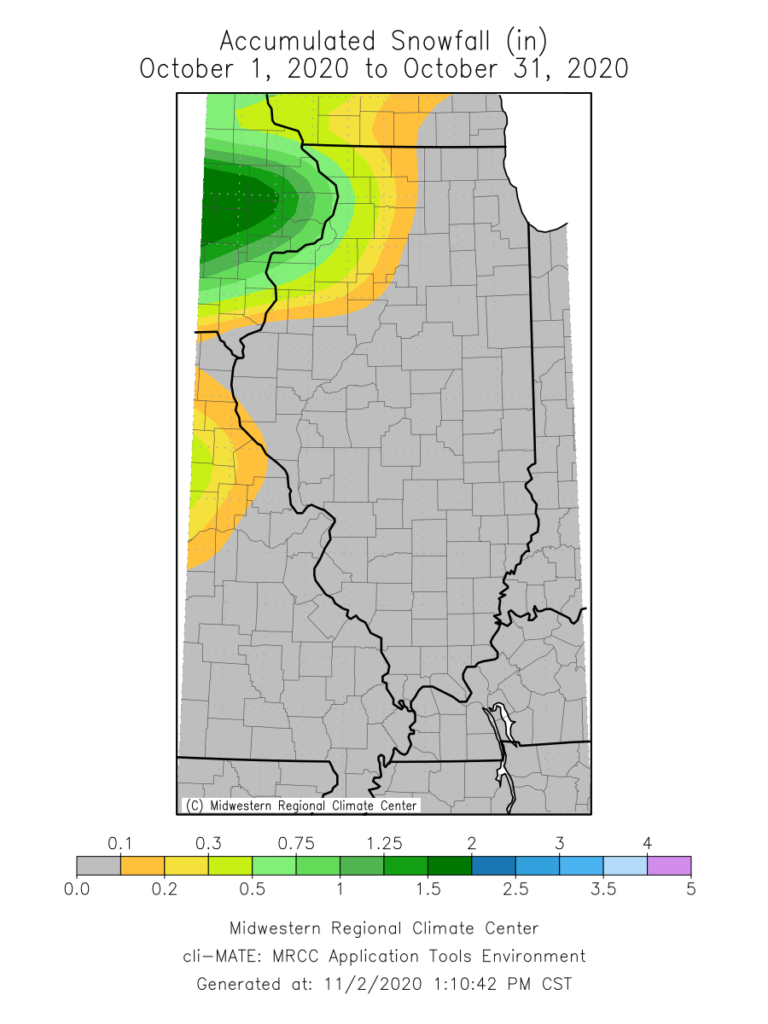
The map below shows the climatological earliest first measurable snowfall on record at stations across the state. The dates range from early to mid-October in northern Illinois to mid-November in southern Illinois.
The map below shows the climatological earliest first measurable snowfall on record at stations across the state. The dates range from early to mid-October in northern Illinois to mid-November in southern Illinois.
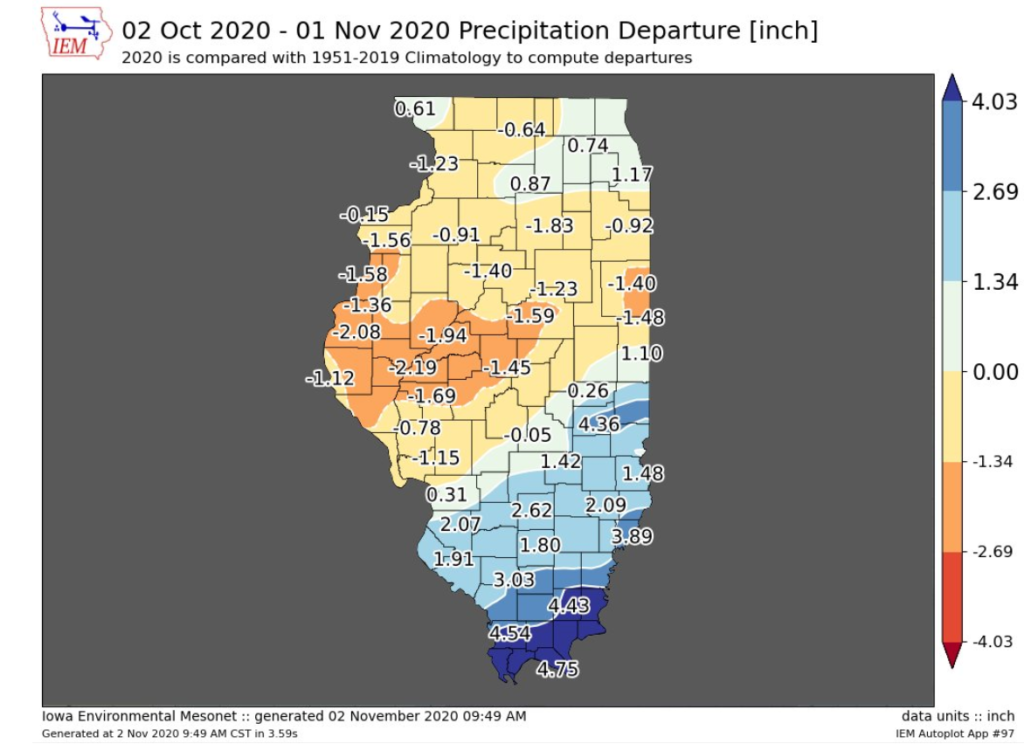
A Wet End to the Month in Southern Illinois
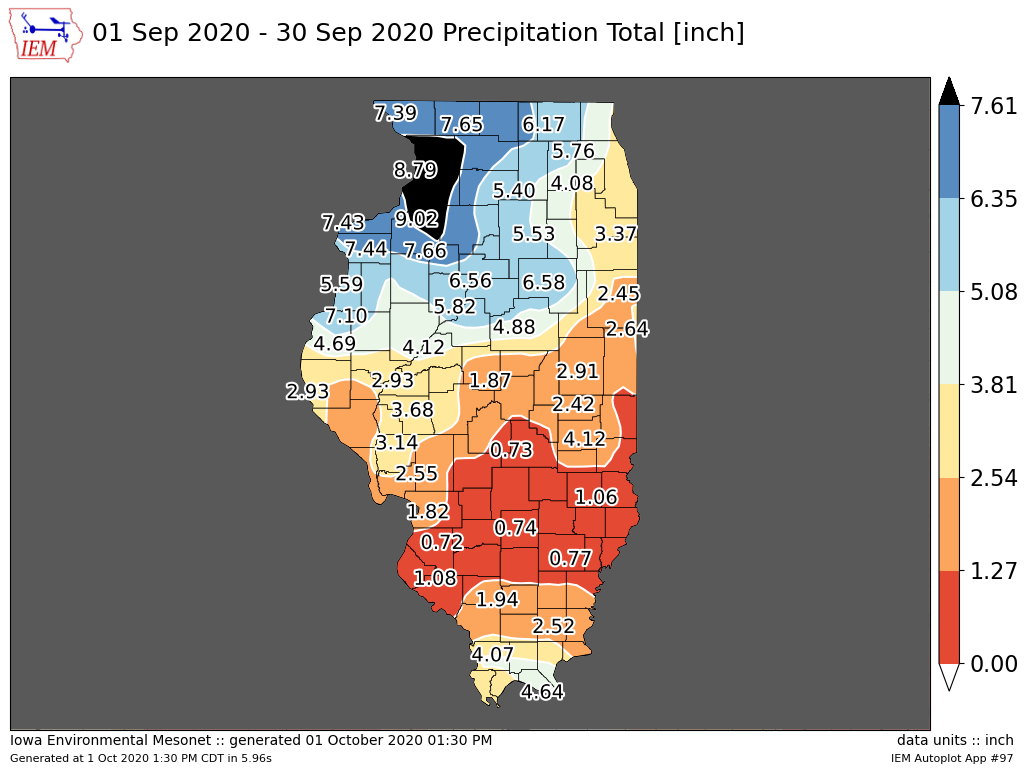
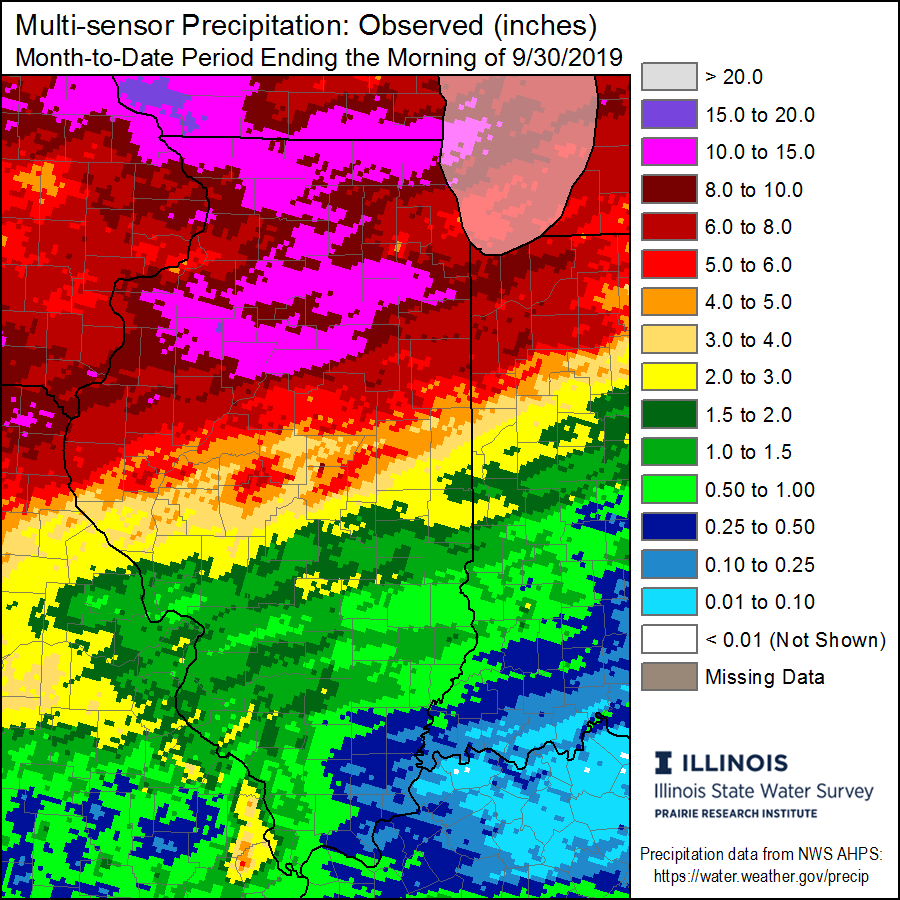
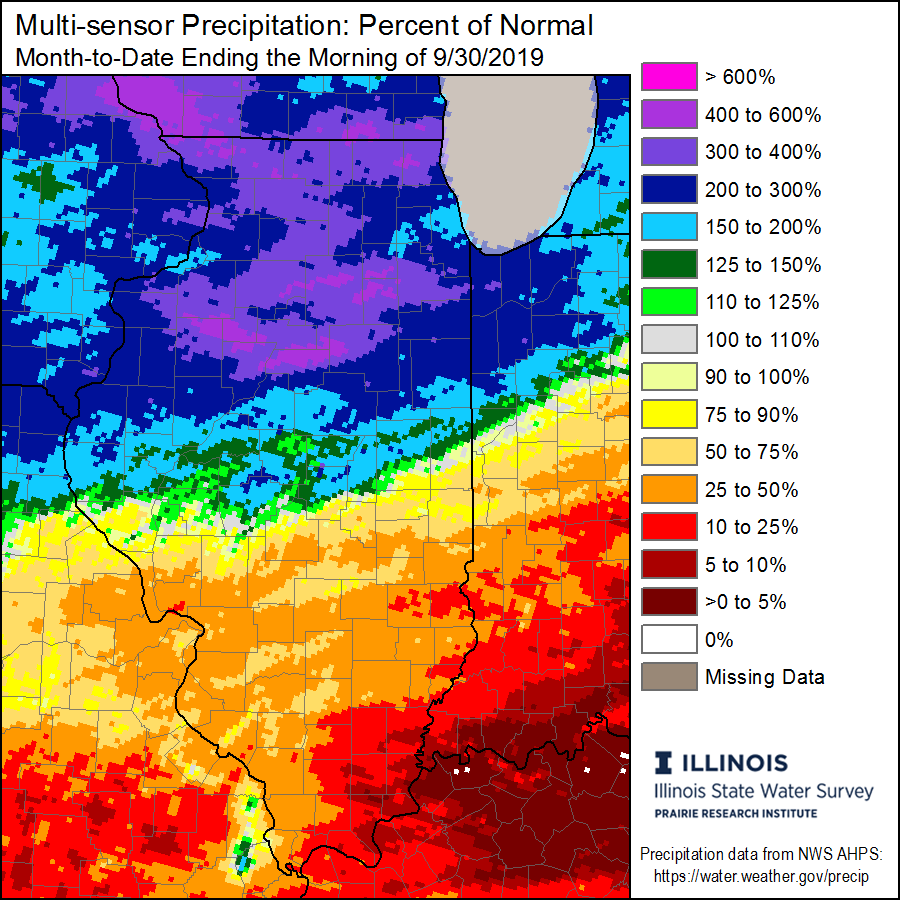
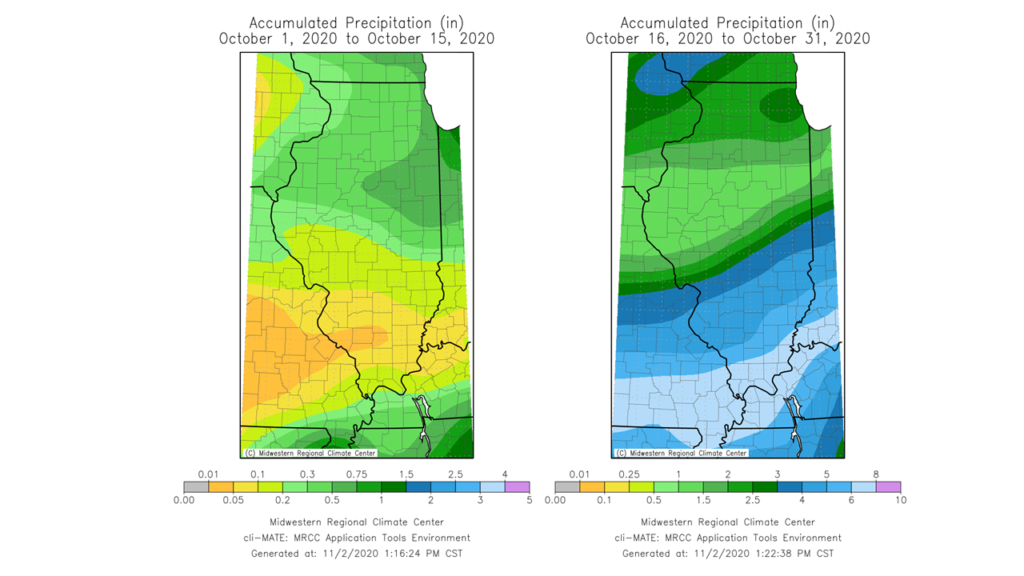
The first half of October was very dry for the southern half of the state, continuing a very dry September. However, around the middle of the month the atmosphere moved into a pattern more conducive to bringing precipitation into southern Illinois. Areas that received less than a tenth of an inch of rainfall in previous weeks saw widespread 4- to 9-inch precipitation totals during the final two weeks of October.
Belleville, for example, recorded its third wettest October with a total of 7.38 inches, following its wettest August and its second wettest July on record. At the end of October, Belleville was only 4 inches away from its wettest year on record, which was 2008 with 56.83 inches of rain.
Drought Continues in Central Illinois
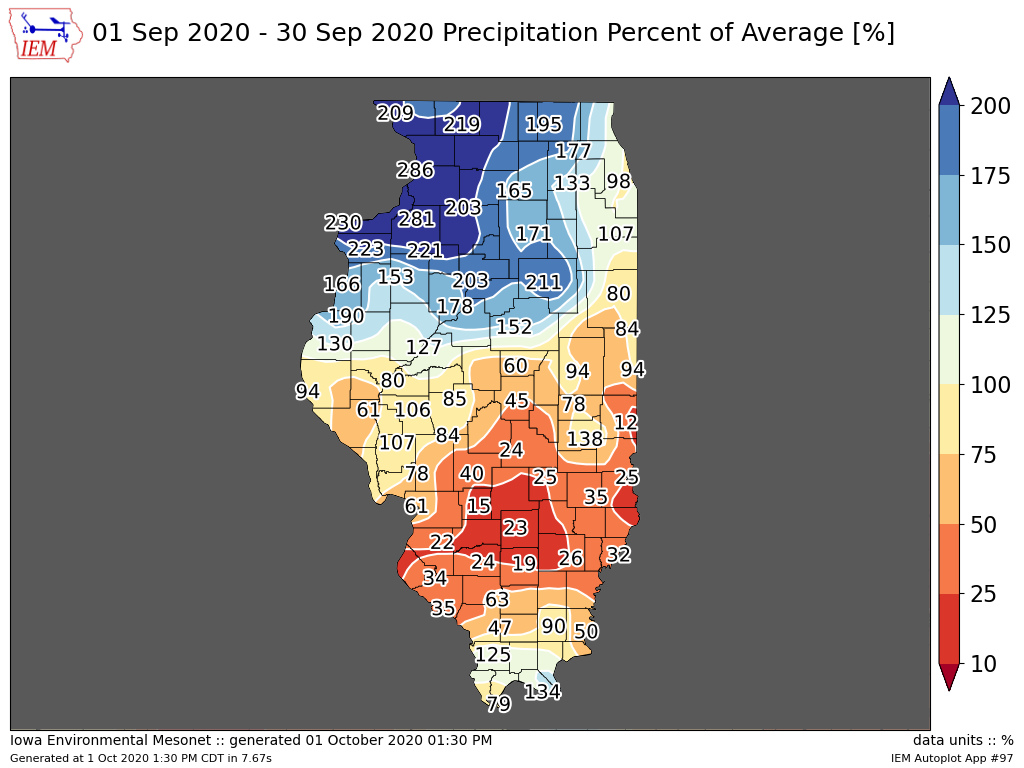
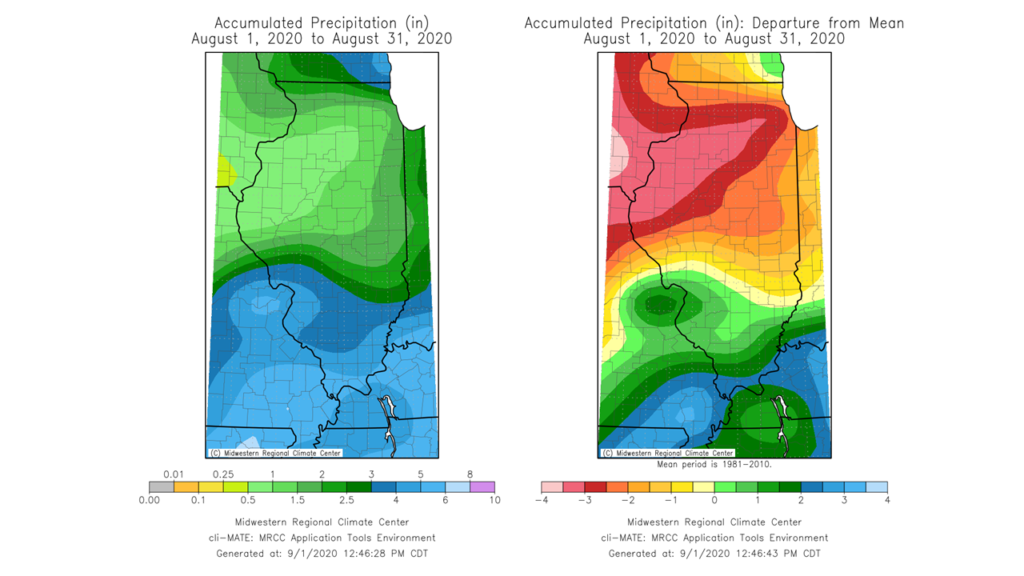
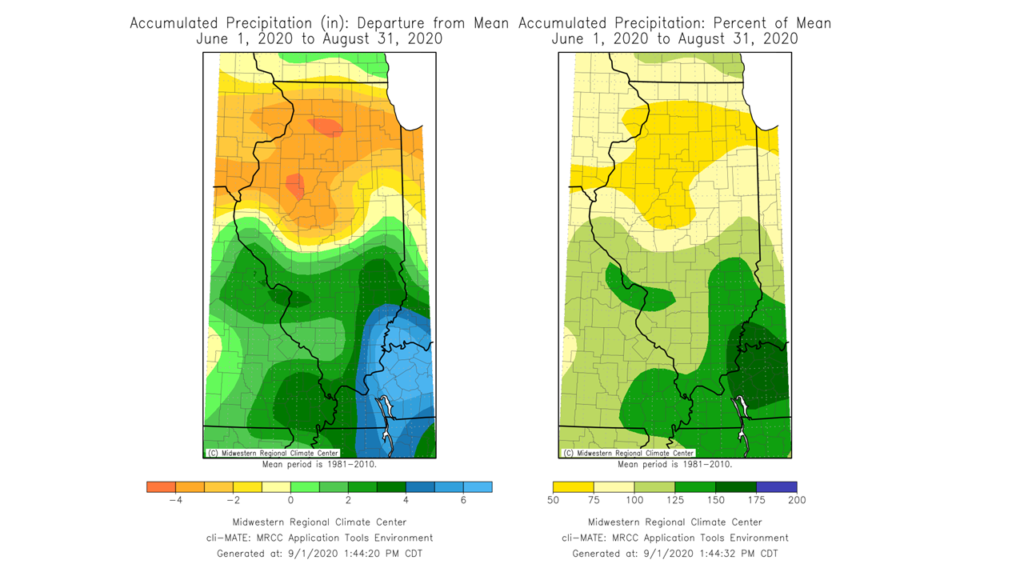
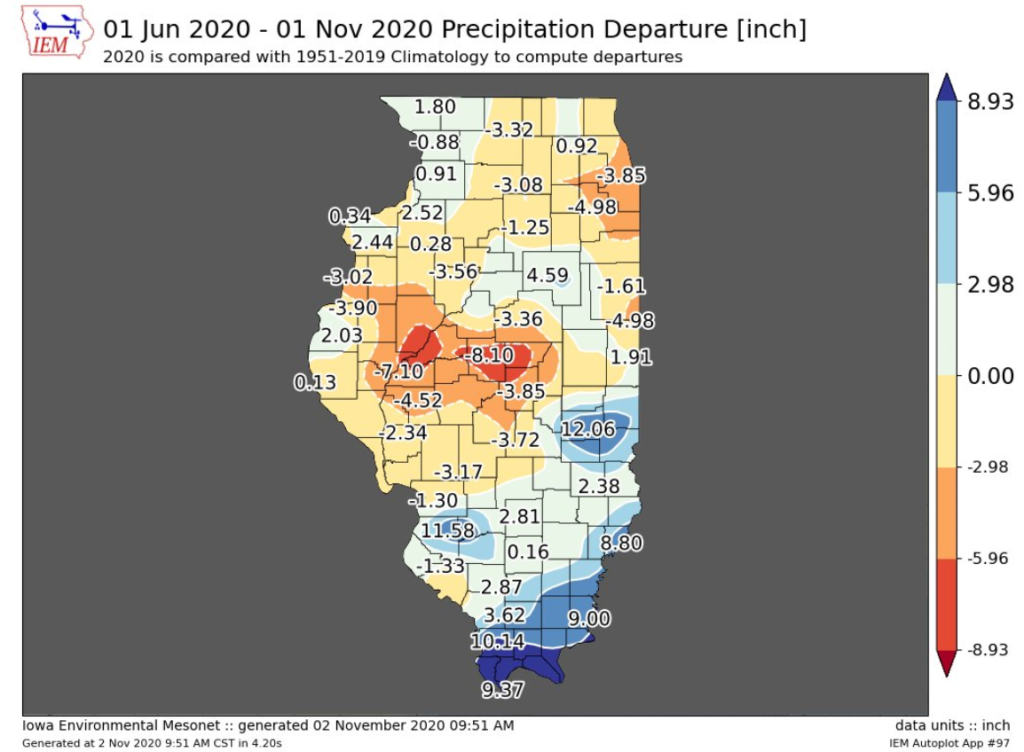
In contrast to the wet end of October in southern Illinois, much of central Illinois ended yet another month with below average precipitation. The maps below show 30- and 180-day precipitation deficits across the state. Most of central and western Illinois received between 1 and 3 inches below average precipitation in October, adding to existing precipitation deficits from dry months in August and September.
Total six-month precipitation deficits in central Illinois exceed 7 inches in Fulton and Mason Counties and 8 inches in parts of Logan and Macon Counties. At Mount Pulaski in Logan County, for example, the June 1 to November 1 precipitation deficit of 8.47 inches is the third largest on record, smaller only than 1988 and 1893. However, it should be noted that Mount Pulaski and the surrounding areas of Logan and Macon Counties received more precipitation in the first four months of this year than in all of 1988. Therefore, drought conditions, although severe, are not nearly to the extent of those in 1988.
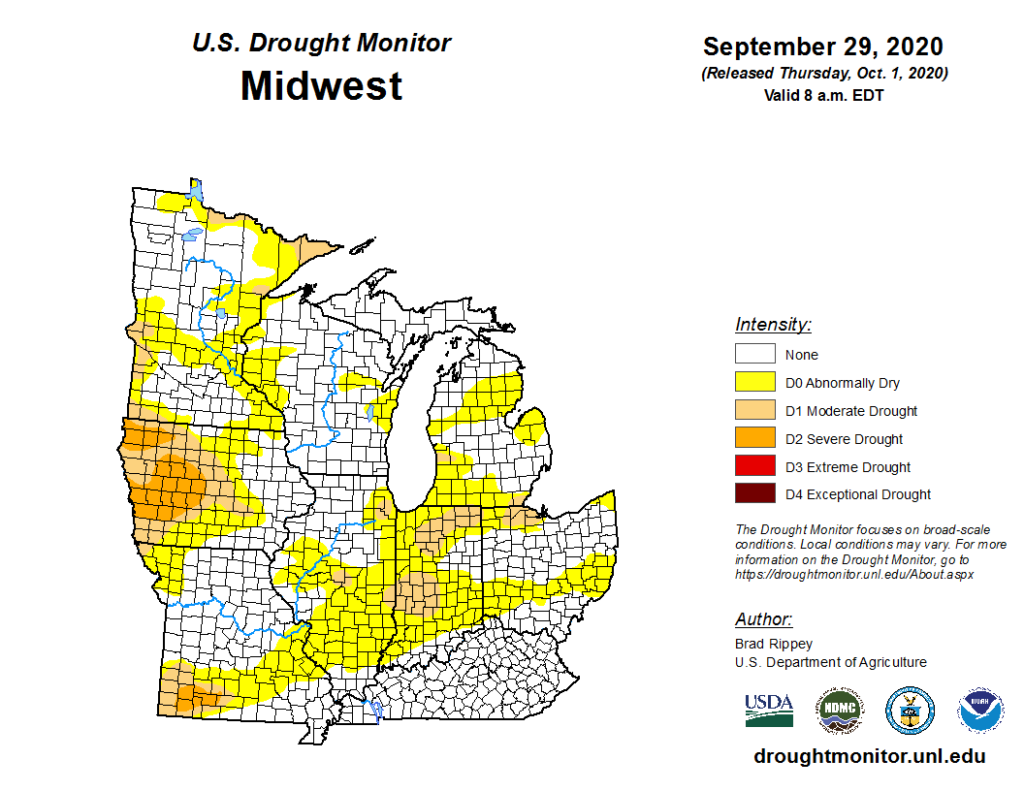
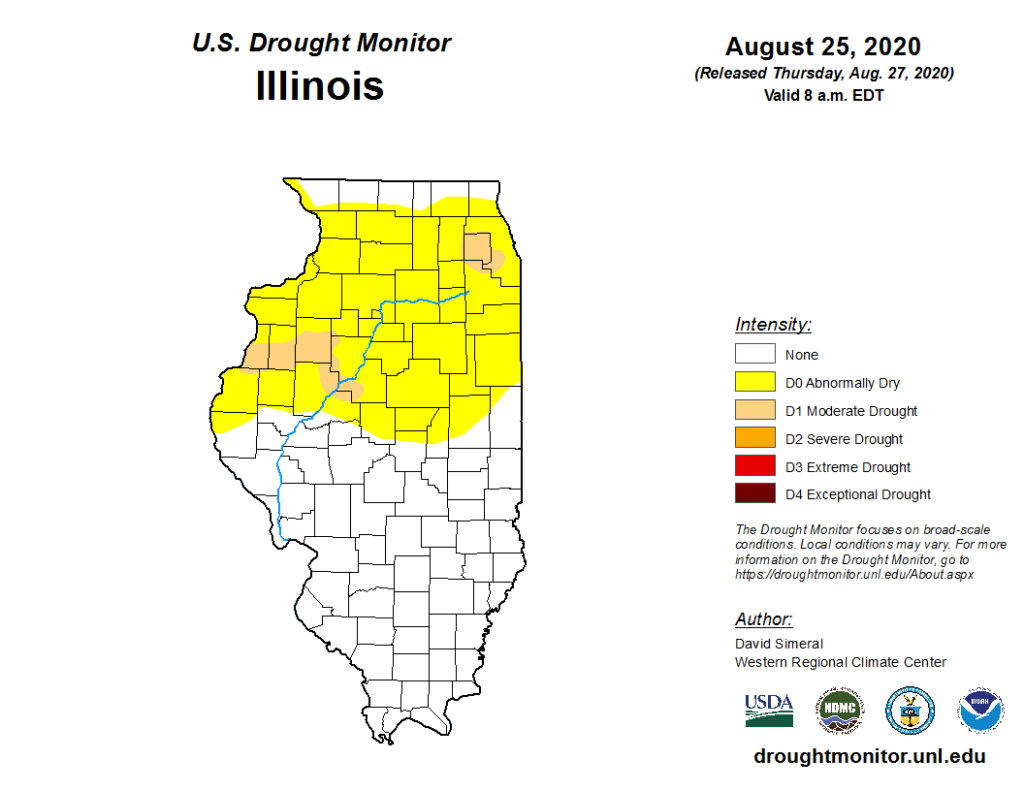
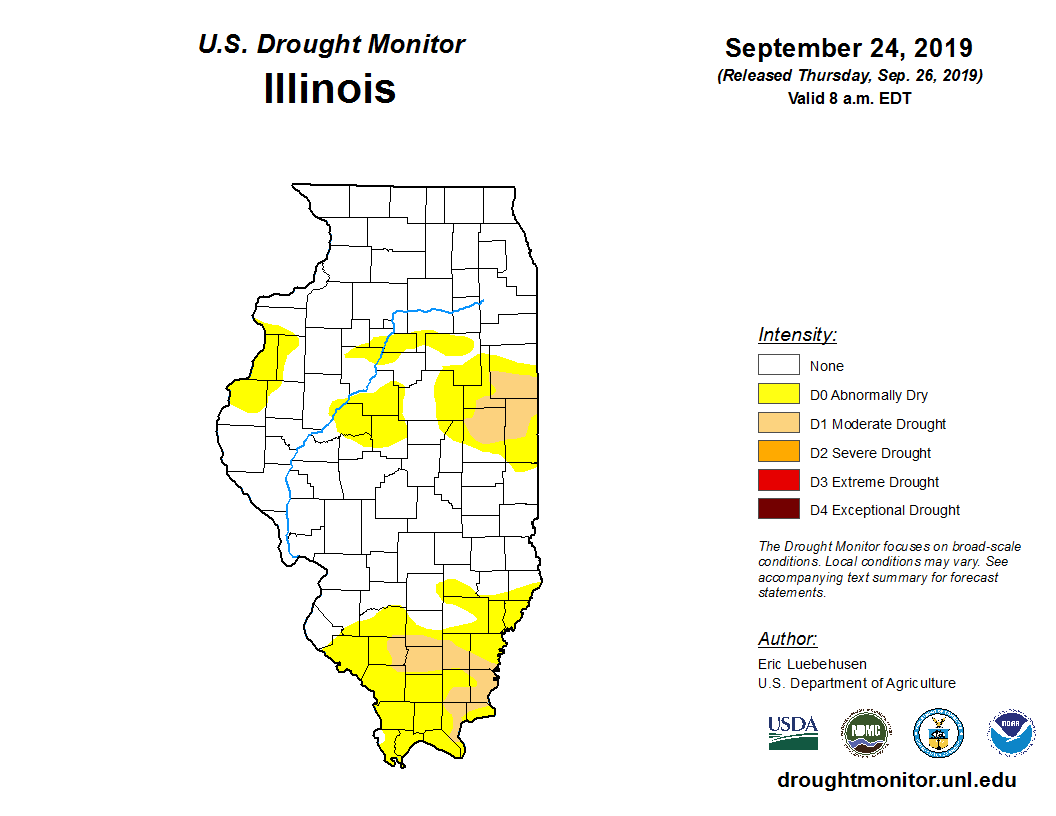
The most recent, October 27th version of the U.S. Drought Monitor showed continued widespread moderate drought across central Illinois in response to the rainfall deficits and below normal soil moisture and streamflow.
Outlooks
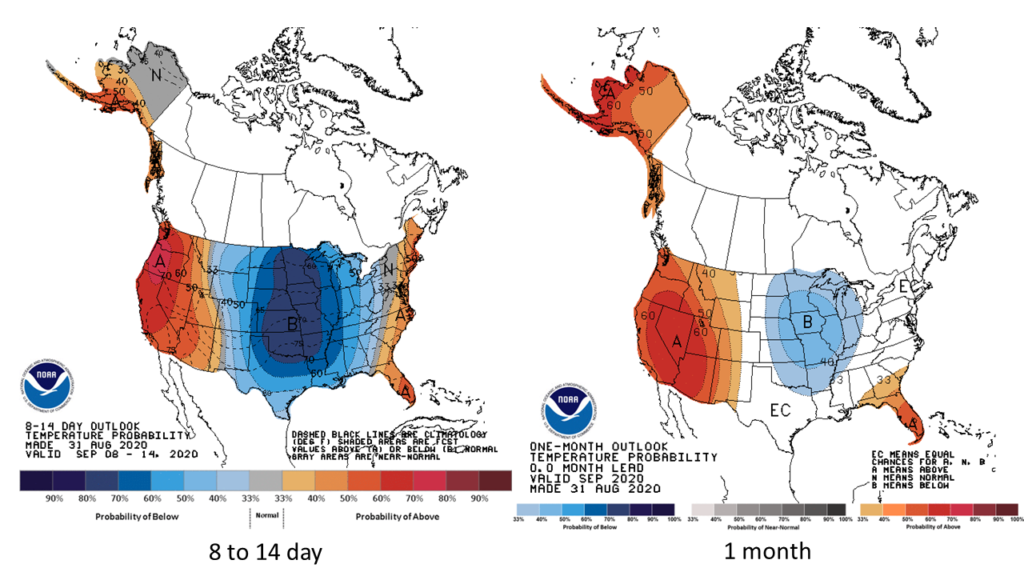
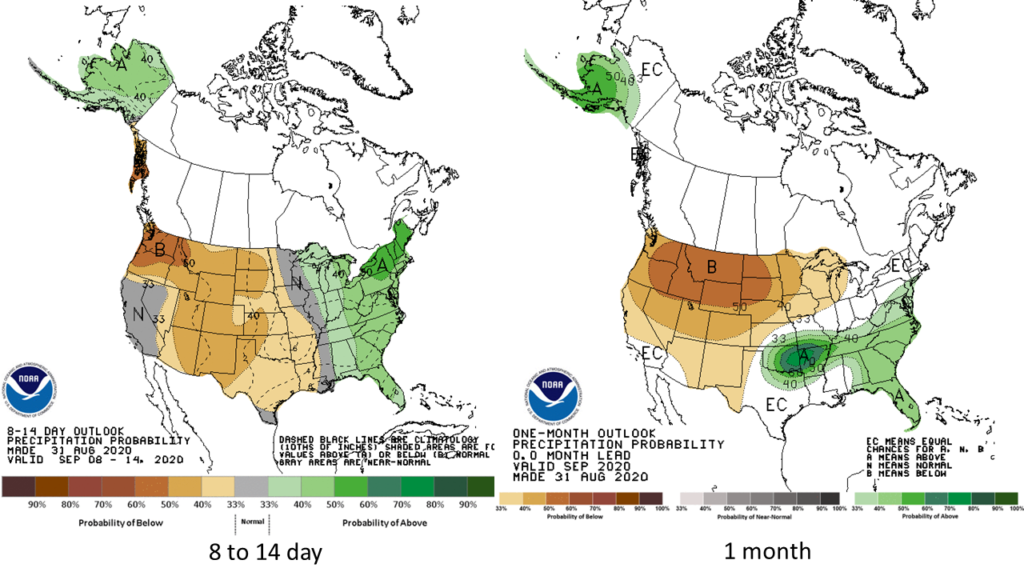
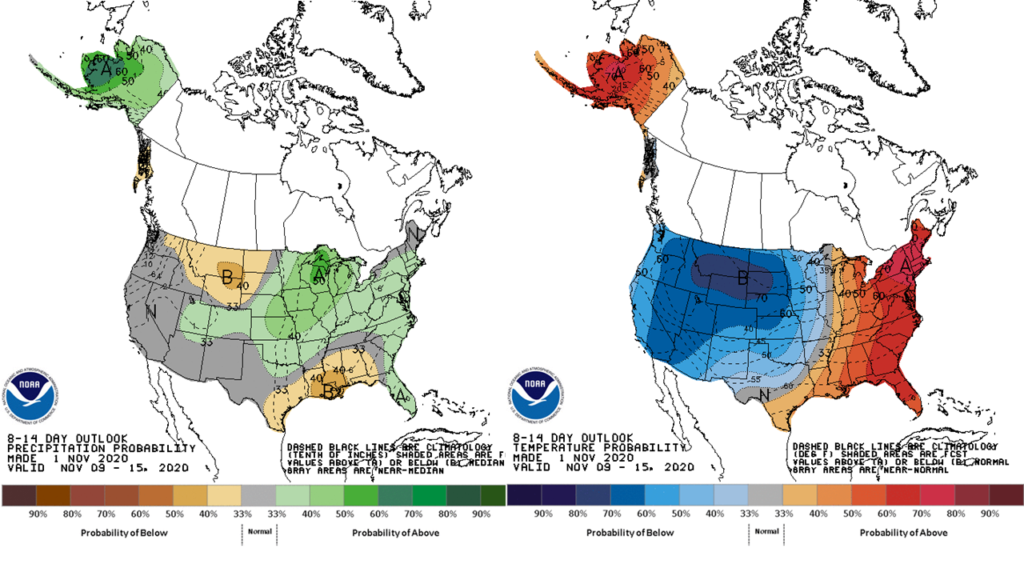
Pleasant weather is in store for the state during the first week of November. However, the Climate Prediction Center’s 8- to 14-day outlooks indicate an imminent pattern change in the second week of November, with odds moving back to below average temperatures, especially to the northwest, and above average precipitation statewide.
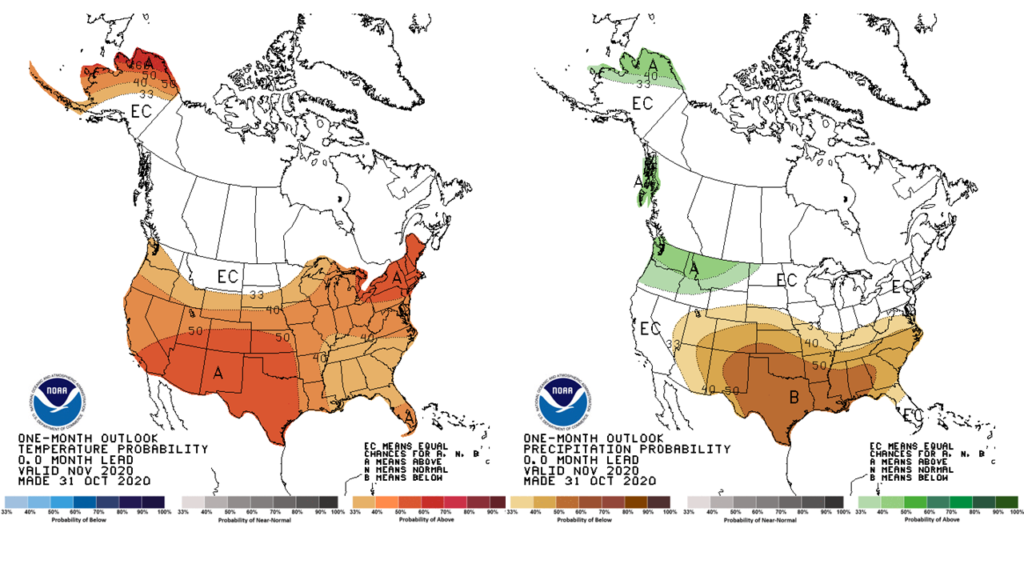
The most recent one-month outlooks for the entire month of November continue to show a strong La Niña influence, with elevated odds of warmer than normal conditions throughout the central U.S. and drier than normal weather in the south.
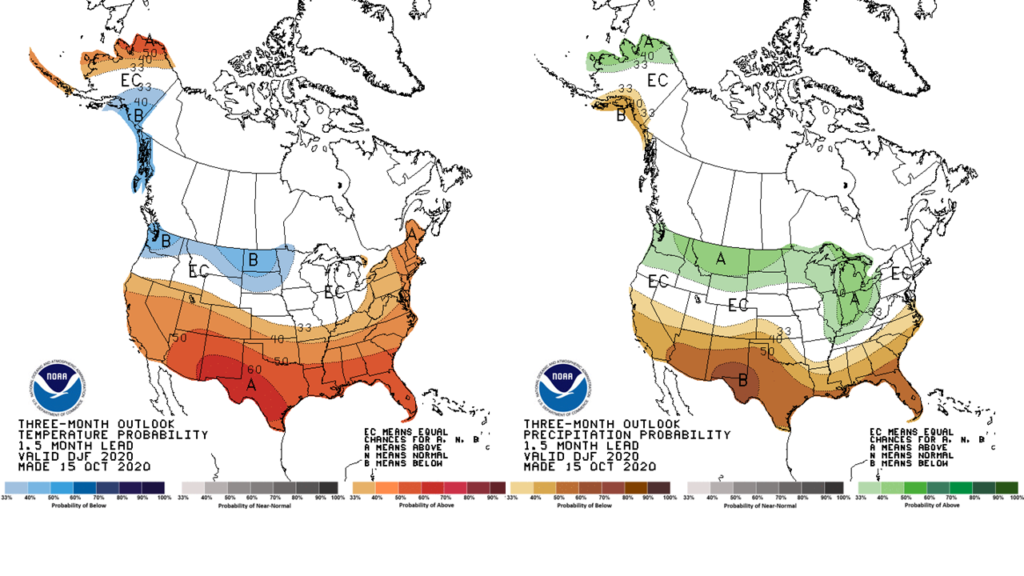
Finally, the three-month outlooks for climatological winter, December–February, show equal chances of warmer or colder than normal conditions in Illinois. However, the odds increase for wetter than normal conditions later in winter.