Thursday Highlights – Drought Monitor and El Nino Forecast

Here are two highlights for today:

U.S. Drought Monitor

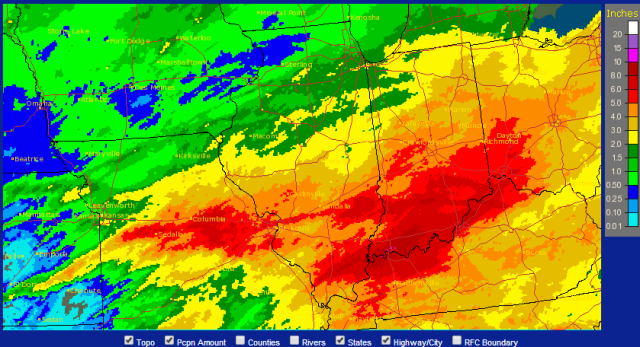
After some concerns of dryness over the last several months in parts of Illinois, the conditions across Illinois were much wetter in the last two weeks. Rainfall totals were especially heavy south of Interstate 72 and ranged from 3 to 8 inches or more (see map below).

The U.S. Drought Monitor has removed all areas of drought in Illinois and greatly reduced the region of “abnormally dry” conditions.

AHPSPrecipitationAnalysis

Climate Prediction Center El Niño Forecast

The NOAA Climate Prediction Center issued a new El Niño Watch today, saying …

While ENSO-neutral is favored for Northern Hemisphere spring, the chances of El Niño increase during the remainder of the year, exceeding 50% by summer.

This reflects a slightly stronger chance of El Niño arriving this summer than mentioned in their post a month ago. However, they caution that there is still a great deal of uncertainty in the timing and strength of the El Niño and recognize that the skill in forecasting El Niño this early in spring is low. This is a less certain forecast than the one issued by the Australian Bureau of Meteorology earlier this week, indicating that there was a greater than 70 percent of an El Niño event by June.

Nation Cut in Two by Drought

Click to enlarge.
Click to enlarge.

The latest US Drought Monitor map from May 14, 2013, shows a Dr. Jekyll/Mr. Hyde nation when it comes to drought. Much of the country to the west of the 96° longitude is in some stage of drought while the country to the east of that line is largely drought free for the moment. Hardest hit have been the Plains states which in some cases are in year 2 or 3 of this drought.
By the way, the US Drought Monitor began about 13 years ago to provide one, unified map of drought across the United States. It is produced in partnership between the National Drought Mitigation Center at the University of Nebraska-Lincoln, the United States Department of Agriculture, and the National Oceanic and Atmospheric Administration with lots of input from scientists, state climatologists, state and local agencies, university extension, landowners, farmers, etc.  Maps are updated weekly and released on Thursday mornings.
Click to enlarge.
Click to enlarge.

The precipitation pattern so far this year reflects these differences between east and west. The map is the current year to date departure from average precipitation produced by the NWS. Areas in green and blue are 2 to 8 inches above average and include much of the Midwest and Southeast. Areas in yellow are 2 to 6 inches below average. Hardest hit so far has been the West Coast with departures more than a foot below average.  There are large areas shaded gray which show near-average conditions. However, much of the west needs many more months of average precipitation or even above-average precipitation to start a recovery from their current drought situation.
Click to enlarge.
Click to enlarge.

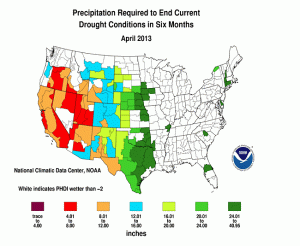
The National Climatic Data Center has a product that gives a rough idea of the amount of precipitation needed over the next 6 months to recover from drought. I say “a rough idea” because the timing and intensity of the precipitation is important as well. The effect of getting 3 inches in 30 minutes is different than getting 3 inches over 3 days. The first will cause lots of runoff while the second will have a better chance of recharging soil moisture. As you can see, it will take a considerable amount of precipitation in the Plains states to get out of their current situation.

Good News on Soil Moisture

The Illinois Weather and Crops report was released today by the USDA. As of March 24, the statewide topsoil moisture looked great with 81 percent “adequate” and 11 percent “surplus”. There was some lingering dryness across central Illinois. However, that was before Sunday’s storm that dropped a lot of snow whose water content ranged from 0.5 to 1.5 inches in that region.
Subsoil soil moisture was a little more pessimistic. Statewide numbers included 11 percent “very short”, 26 percent “short”, 58 percent “adequate”, and only 5 percent “surplus”. Some of the lowest numbers were in the northern and western part of the state. Subsoil moisture is not critical in the spring but provides a useful reserve, or cushion, during periods of dry weather in the summer.
The Illinois Weather and Crops is coming off it’s typical winter schedule of once per month to it’s growing season schedule of once a week. The reports can be found here. You can get the reports automatically by subscribing here.

Table from the USDA report, click to enlarge. 

table1

Guidelines on soil moisture (USDA)

Topsoil is defined as the top six inches. Subsoil is defined as the area from six inches below the surface to a depth of three to four feet.
Very Short – Soil moisture supplies are significantly less than what is required for normal plant development. Growth has been stopped or nearly so and plants are showing visible signs of moisture stress. Under these conditions, plants will quickly suffer irreparable damage.
Short – Soil dry. Seed germination and/or normal crop growth and development would be curtailed.
Adequate – Soil moist. Seed germination and/or crop growth and development would be normal or unhindered.
Surplus – Soil wet. Fields may be muddy and will generally be unable to absorb additional moisture. Young developing crops may be yellowing from excess moisture.

Illinois Drought Free

According to the US Drought Monitor, Illinois is now drought free for the first time since April 3, 2012. Most areas in Illinois have seen positive responses in soil moisture, stream flows, lake levels, and groundwater levels since the fall. A small area of northwest Illinois remains as abnormally dry due to some lingering concerns about subsoil moisture and groundwater levels in that area.
il_dm