Earlier this year the National Climate Assessment for Illinois was released, tracking the historical changes in temperatures and precipitation in Illinois. You can find the full report for Illinois and other states at the State Climate Summaries website.
Here is Key Message #1
Average annual temperature has increased by about 1°F since the beginning of the 20th century. There has been seasonal variation in this warming, with average spring temperature increasing by about 2°F and average summer
temperature increasing very little. Under a higher emissions pathway, historically unprecedented warming is projected by the end of the 21st century.
Key Message #2
Precipitation in spring and summer has generally been above average over the past two decades, affecting agriculture in both positive (adequate soil moisture) and negative (delays in spring planting) ways. Precipitation in winter and spring is projected to increase, which poses a continuing risk of spring planting delays.
Key Message #3
Severe flooding and drought have occurred periodically in recent years. Future increases in extreme precipitation events and in evaporation rates may increase the intensity of both floods and droughts.
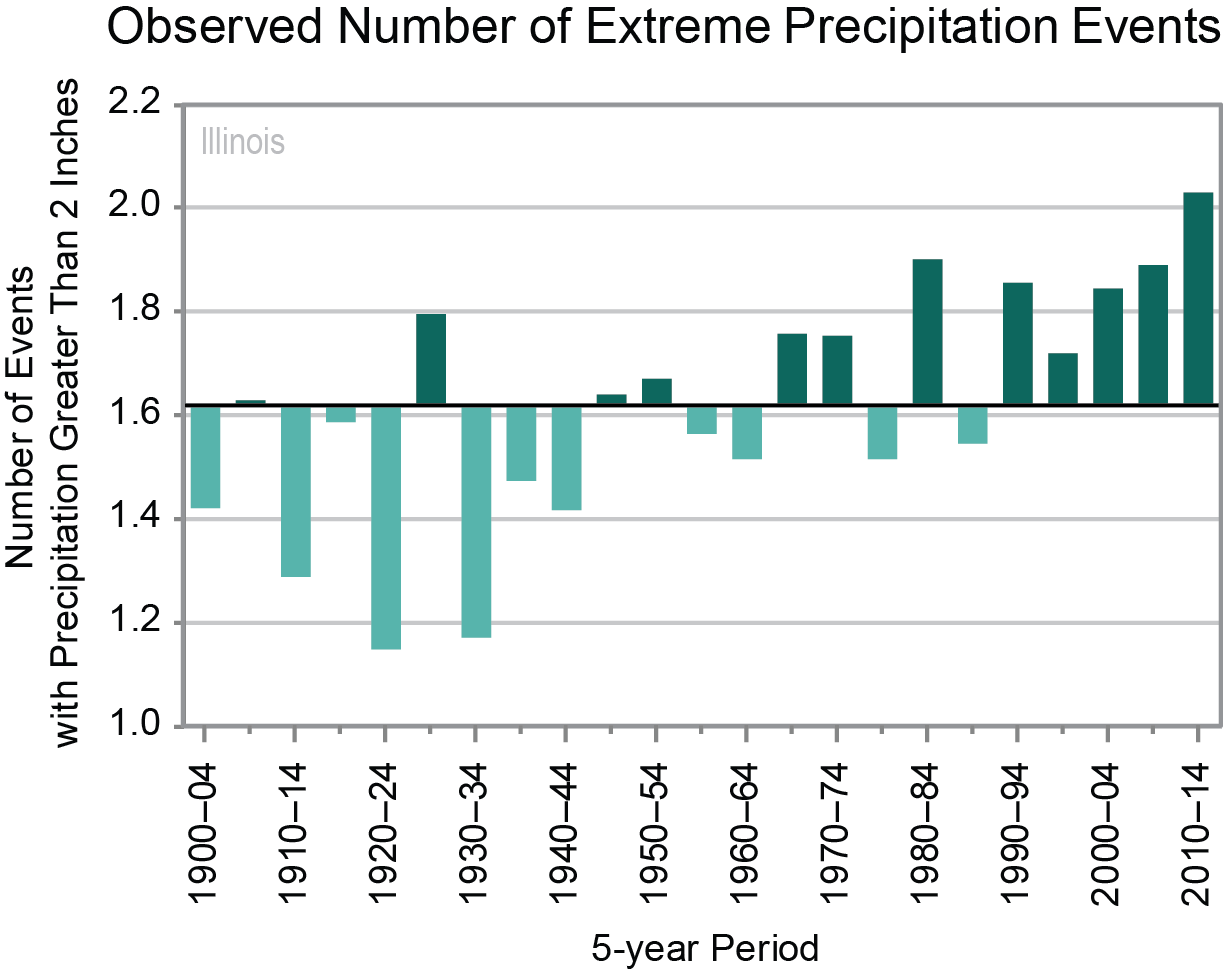
You may notice that two out of the three messages relate to increases in precipitation and especially heavy rainfall events. The graphic I found most compelling was this one for the increasing number of 2-inch rain events with time. The caption explains how this graph was created. The increased frequency in 2-inch rain events seen since the early 1980s lines up very well with my experience and research over the years in Illinois.
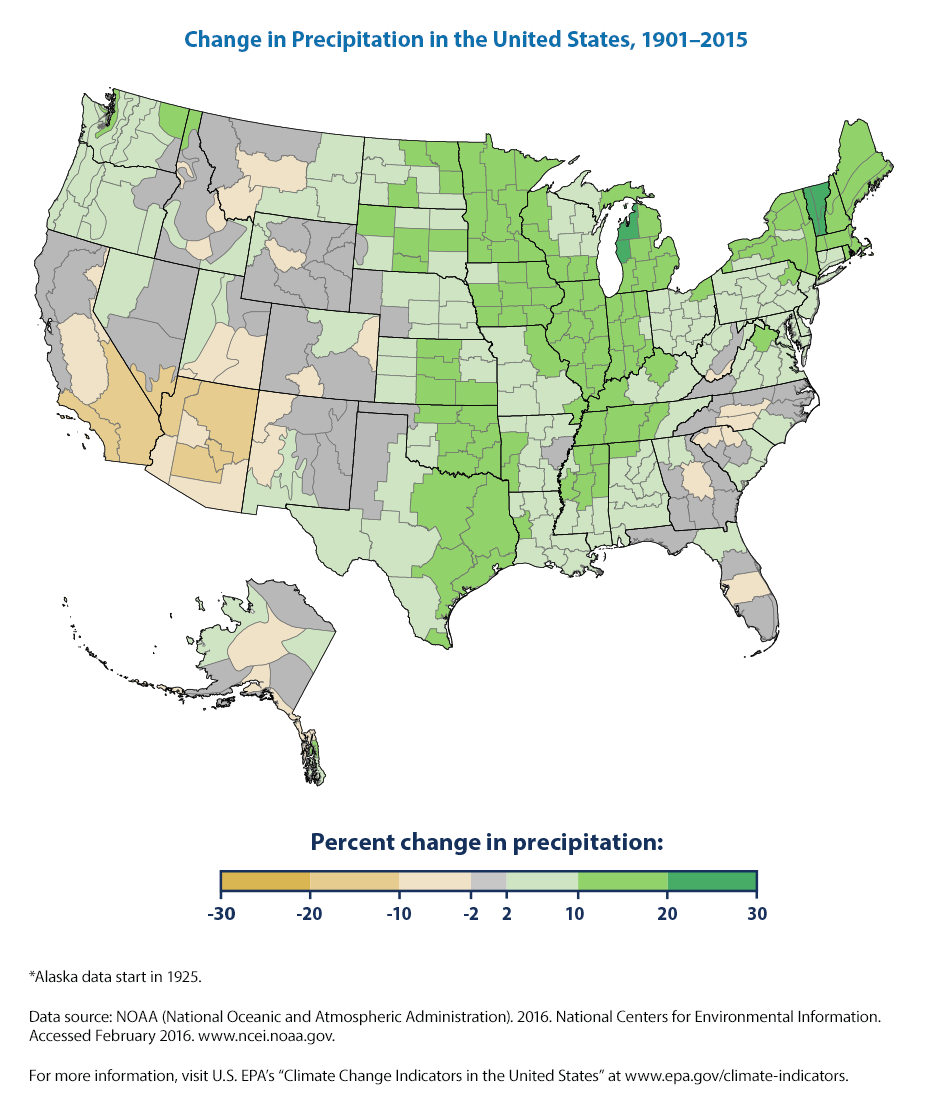
As shown in this map from the US EPA website, precipitation across Illinois has increased by 10 to 20 percent in the last 115 years. Many of the surrounding states have seen similar increases in precipitation.
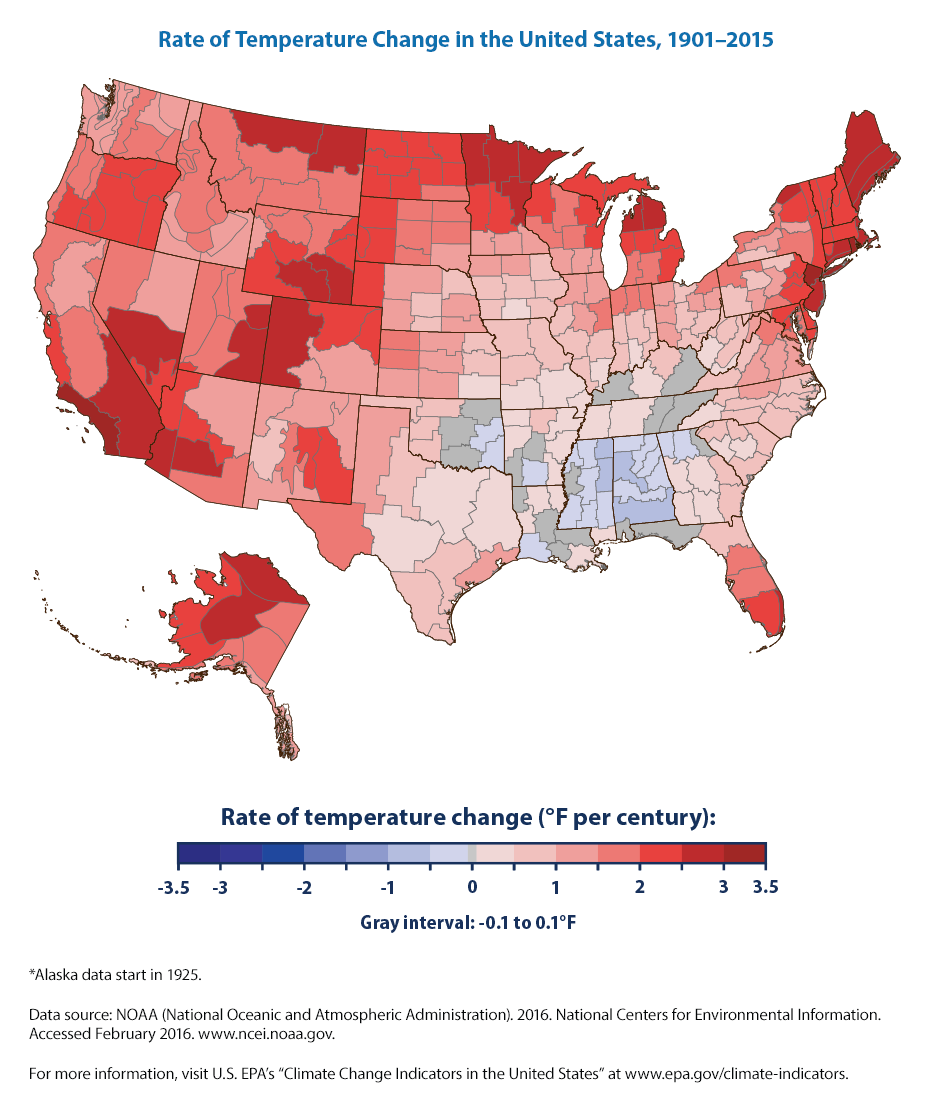
As noted in the first key message, Illinois has experienced warming in the past 115 years of about 1 degree F. However, warming has been more pronounced in the northern and western states.