The preliminary statewide average June temperature was 73.5 degrees, 1.6 degrees above the 1991–2020 average and the 30th warmest on record going back to 1895. The preliminary statewide average total June precipitation was 2.85 inches, 1.23 inches below the 1991–2020 average and the 25th driest on record statewide.
Data are provisional and may change slightly over time.
Is Summer Over Yet?
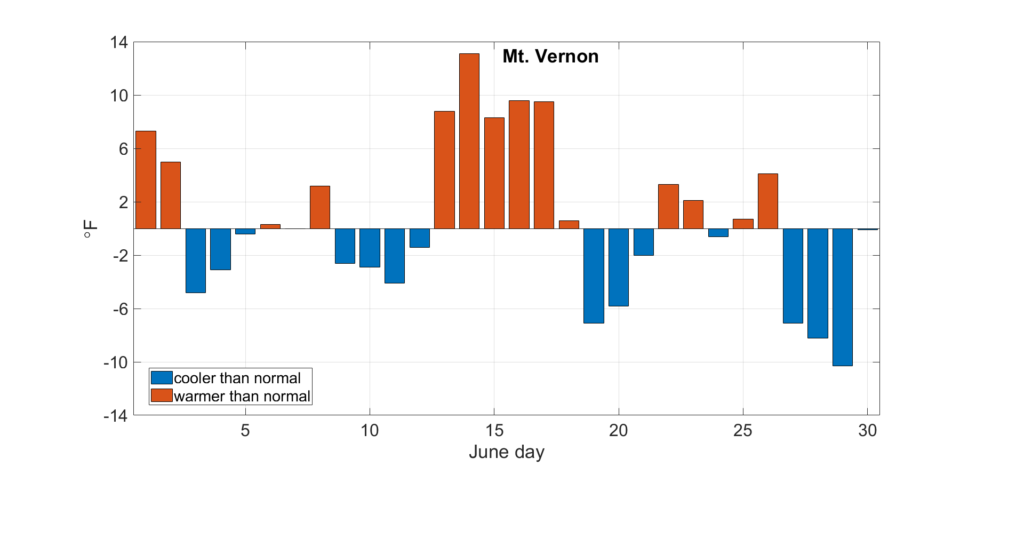
Full disclosure: summer is by far my least favorite season in Illinois, so my apologies to the hot weather lovers out there. June ended warmer than normal across the state, but not extremely so. Daily temperature departures from normal in Mt. Vernon (Figure 1) show about half of the days last month were warmer than normal, and half were cooler than normal. We did experience a prolonged heat wave in the middle of June, with temperatures 15–20 degrees above normal. However, outside of this event, the hottest days were broken up by a handful of days with below normal temperatures.
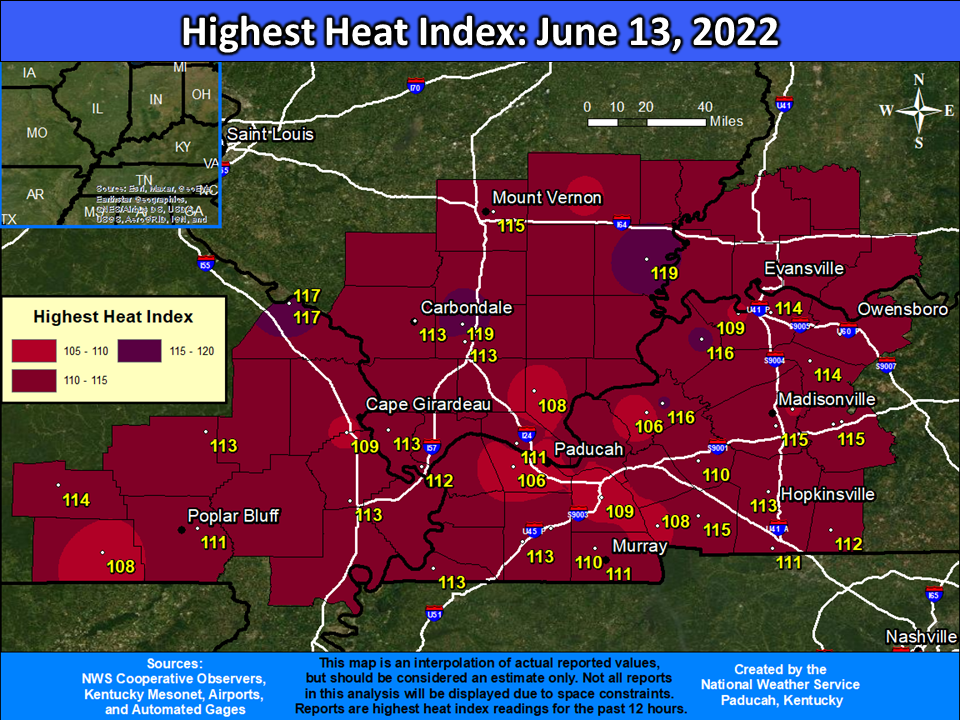
The week of June 13–18 was extremely warm across the state. High temperatures reached into the upper 90s on multiple days and even broke 100 degrees in a few stations. The 5-day average temperatures that week were 6 to 10 degrees above normal across the state. Combined with humidity, heat index values approached 120 degrees in parts of southern Illinois on June 13 and 14 (Figure 2).
The high temperatures and humidity in mid-June made for some very warm nights. The all-time high nighttime temperature records for June were broken at 8 stations in Illinois that week, including a 78-degree low temperature in Peoria and an incredible 83-degree low at Chicago’s Midway Airport. The latter broke the previous June low temperature record at Midway by 4 degrees.
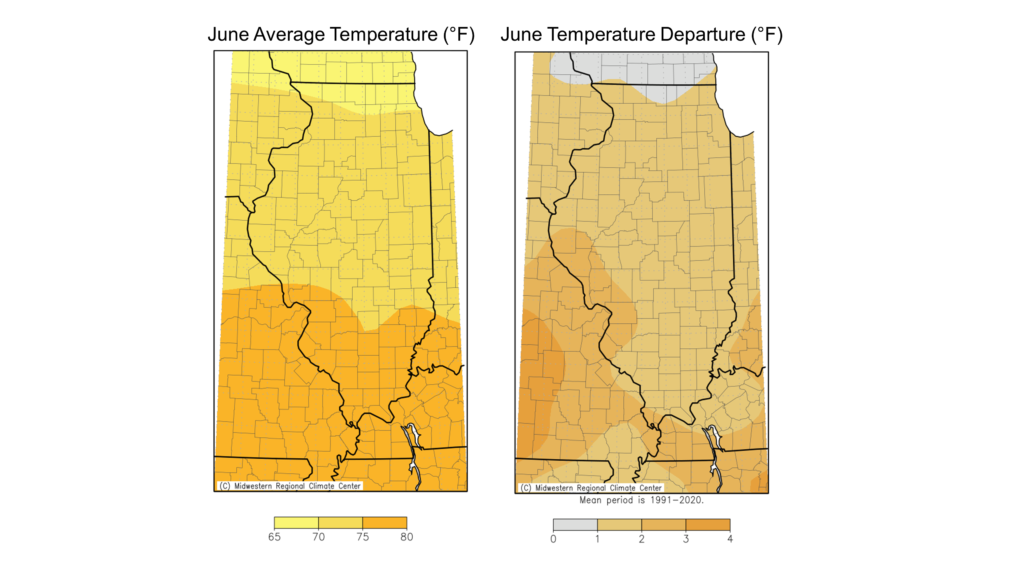
We did get breaks from the heat in June, although only temporarily. Overall, June average temperatures ranged from the high 60s in far northern Illinois to the high 70s in southern Illinois, between 1 and 3 degrees above normal (Figure 3). The hottest point in the state last month was Bean Ridge in Alexander County with an average June temperature of 78 degrees, and the coolest part of the state was Waukegan with an average June temperature of 67.7 degrees.
Altogether, daily high maximum temperature records were broken last month at 58 stations, and daily high minimum temperature records were broken at 97 stations. Eight stations broke their all-time June high nighttime temperature records.
Daily low minimum temperature records were broken at 4 stations, including a 46-degree low in Normal on June 19.
The preliminary statewide average June temperature was 73.5 degrees, 1.6 degrees above the 1991–2020 average and the 30th warmest on record going back to 1895.
A Very Dry June
June is typically one of the wettest calendar months across Illinois; however, last month was unusually dry. Total precipitation last month ranged from less than 1 inch in east-central Illinois to just over 5 inches in northwest Illinois. Only the Quad Cities area was wetter than normal last month, while other places in the state were between one-half inch and 3 inches drier than normal (Figure 4).
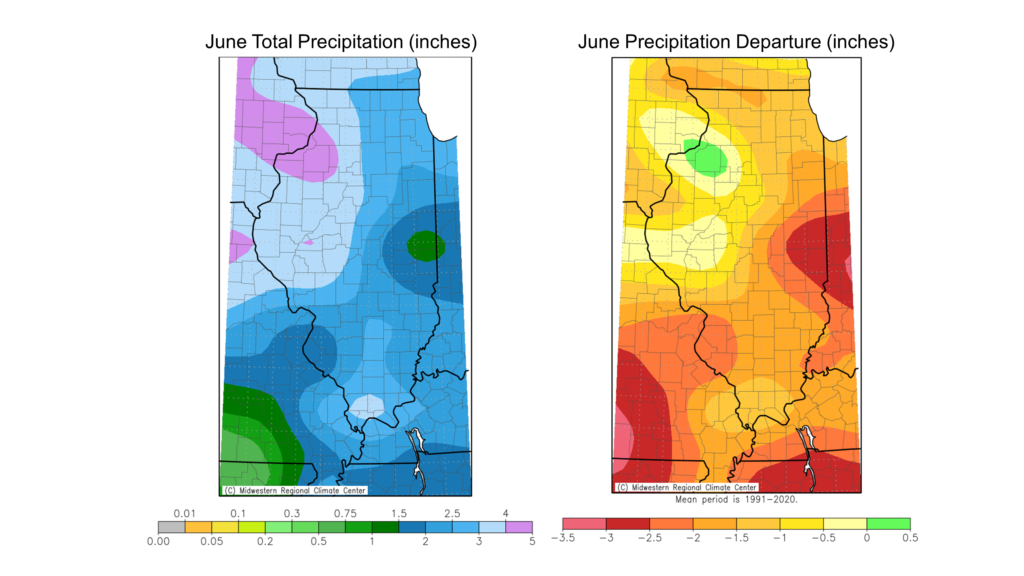
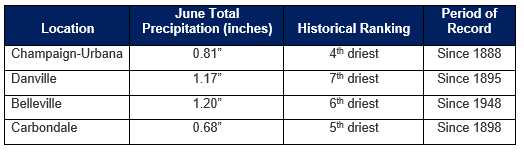
While June was drier than normal for most in Illinois, it was extremely dry for folks in east-central and southern Illinois. Table 1 shows total June precipitation and historical rankings for several locations in the state.
The wettest point in the state in June was Jacksonville, with just under 8 inches of rain. In contrast, Sidell in Vermilion County received just 0.60 inches in June. The preliminary statewide average total June precipitation was 2.85 inches, 1.23 inches below the 1991–2020 average and the 25th driest on record statewide.
July and Late Summer Outlooks
We would like to see July bring a bit cooler and wetter than normal weather to take the edge off the drought in parts of Illinois. The latest outlooks from the Climate Prediction Center show higher odds of warmer than normal weather in July, and slightly higher chances of drier than normal conditions for southern and central Illinois (Figure 5).
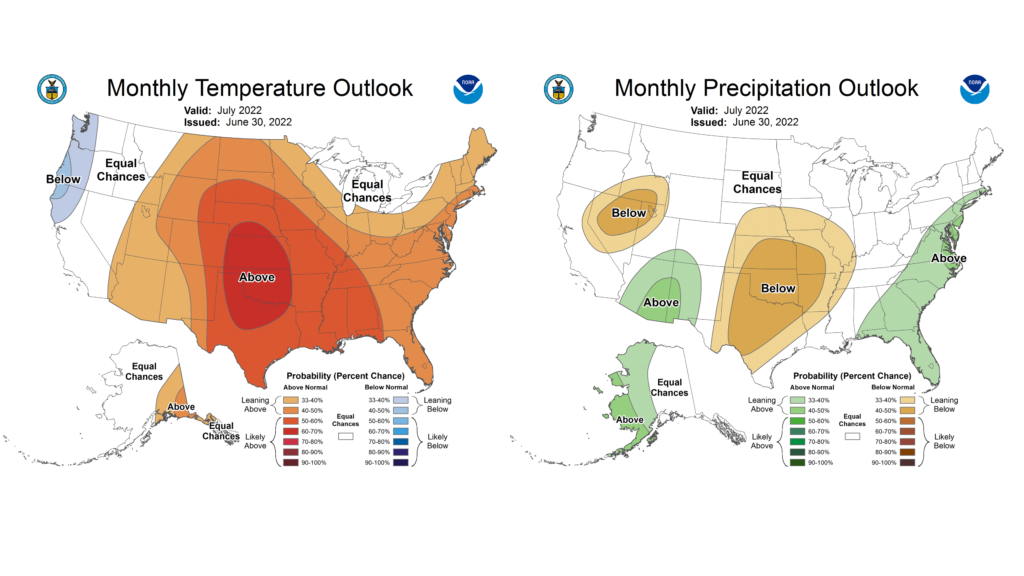
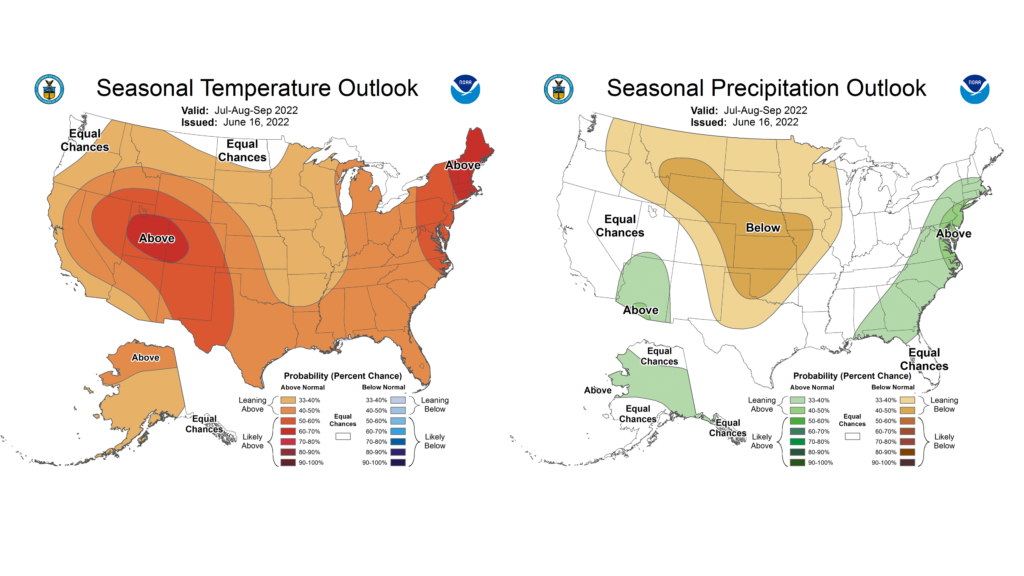
Meanwhile, outlooks for July through September continue to lean toward warmer than normal conditions across the entire central U.S. Summer precipitation outlooks are also leaning a bit toward drier than normal weather in western Illinois, with much stronger odds in the Plains (Figure 6).