

As of April 25, the statewide average precipitation for Illinois is 2.8 inches, which is 94% of normal. However, we have several opportunities for widespread rains this week and into the weekend, according to the NWS precipitation forecast.
The first round of rain on Wednesday and Thursday has potential rainfall amounts of 1 to 2 inches across most of Illinois, along with the chance for severe weather. Continue reading “Widespread, heavy rains possible over next week in Illinois”
National Climate Assessment for Illinois
Earlier this year the National Climate Assessment for Illinois was released, tracking the historical changes in temperatures and precipitation in Illinois. You can find the full report for Illinois and other states at the State Climate Summaries website.
Here is Key Message #1
Average annual temperature has increased by about 1°F since the beginning of the 20th century. There has been seasonal variation in this warming, with average spring temperature increasing by about 2°F and average summer
temperature increasing very little. Under a higher emissions pathway, historically unprecedented warming is projected by the end of the 21st century.
Key Message #2
Precipitation in spring and summer has generally been above average over the past two decades, affecting agriculture in both positive (adequate soil moisture) and negative (delays in spring planting) ways. Precipitation in winter and spring is projected to increase, which poses a continuing risk of spring planting delays.
Key Message #3
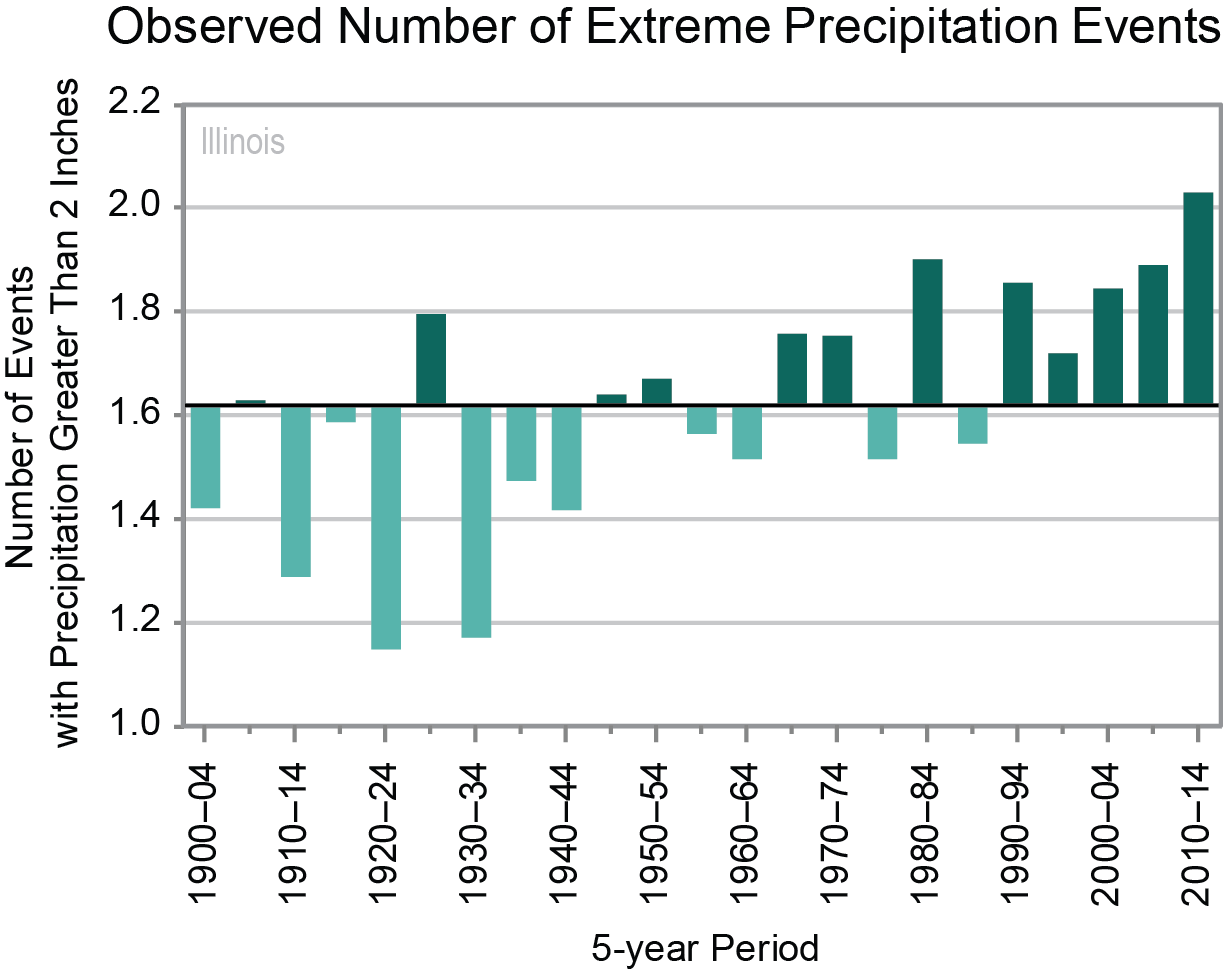
Severe flooding and drought have occurred periodically in recent years. Future increases in extreme precipitation events and in evaporation rates may increase the intensity of both floods and droughts.
You may notice that two out of the three messages relate to increases in precipitation and especially heavy rainfall events. The graphic I found most compelling was this one for the increasing number of 2-inch rain events with time. The caption explains how this graph was created. The increased frequency in 2-inch rain events seen since the early 1980s lines up very well with my experience and research over the years in Illinois.
Continue reading “National Climate Assessment for Illinois”
Above-Average Temperatures Expected to Continue through Fall
The NWS released their latest forecasts for May and beyond. Currently, the Pacific Ocean is in the neutral phase between La Niña and El Niño. There is much debate on if and when El Niño should return. It could happen in late summer. Meanwhile, the theme running through the outlooks is the increased risk of above-average temperatures through the fall. Illinois has been running warmer than average in the last few years. In 2016, 10 out of 12 months were above-average. So far, every month in 2017 has been above-average.
- January 2017: 5.7 degrees above average
- February 2017: 10.1 degrees above average
- March 2017: 1.9 degrees above average
- April 1-19, 2017: 6.5 degrees above average
May: eastern portions of Illinois have a slightly increased chance of being warmer than average. I am going out a little farther on the limb and say that all of Illinois has an increased chance of being warmer than average, based on recent trends and the climate models. Meanwhile, most of Illinois and the Great Lakes are expected to have an increased chance of below-average precipitation. Click to enlarge maps. Continue reading “Above-Average Temperatures Expected to Continue through Fall”
April Showers Bring May Flowers?
The first part of April has been warmer and wetter than average across much of Illinois and the Midwest. As these maps show, there is a wide band of 1 to 3 inches of rain stretching from Kansas, through Missouri, Indiana, Michigan, and Ohio (click to enlarge) in April. These rains have helped ease concerns of any developing drought after the dry winter. In fact, the concerns have reversed and center around delays in field work from wet conditions. Continue reading “April Showers Bring May Flowers?”