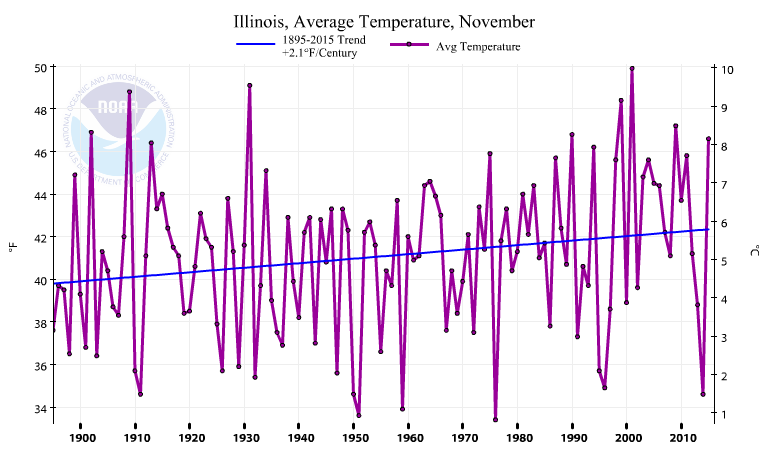
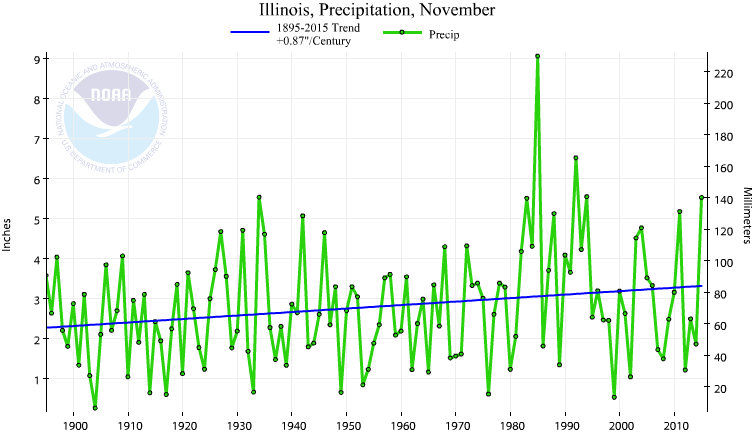
Based on historical data for Illinois, the weather in November is trending towards warmer and wetter conditions over time. Based on the latest NWS forecasts, this November is likely to continue that pattern.
Historical Trends
Temperature
The statewide average temperature for November shows a wide variation from year to year – typical of all months in Illinois. However, there is an underlying warming trend of about 2 degrees over the last century.

Precipitation
The statewide average precipitation for Illinois over time also shows a lot of year to year variability, as well as a trend towards wetter conditions over the last century of about 0.9 inches. We had an exceptionally wet period from the mid-1980s to the mid-1990s. The outstanding November was 1985 when the statewide average precipitation was 9.05 inches, 5.58 inches above the normal of 3.47 inches, and by far the wettest November on record. I remember that gloomy November well – 30 days of unrelenting of overcast skies and rain.

NWS Forecast for November
The NWS forecast for the 6-10 day and 8-14 day period covers early November (below). They show Illinois and much of the central US with a strong chance of being warmer than normal out to November 8. They also show Illinois with a chance of being wetter than normal as well. Their experimental week 3-4 outlook, covering November 5 to 18, shows Illinois with an increased chance of being warmer than normal. And an earlier post discussed the monthly forecast for November, showing Illinois with an increased chance of being warmer than normal.
Click on any of the maps to start a slide show.


