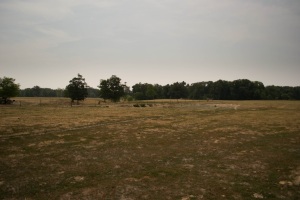
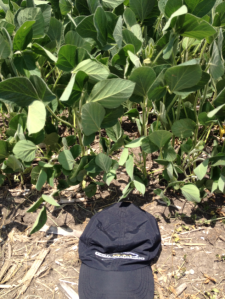
Here are some photos from our student intern that shows conditions on a farm near Sigel Illinois. They were all taken on or around July 1.


Here are some photos I took in Champaign County this afternoon (July 5), just west of Champaign. At the time it was 99 degrees, according to Willard Airport (Champaign).


If you have any pictures of the impact of this year’s drought that you would like to share, please let me know. I’m especially interested in pictures related to agriculture or water supplies (ponds, rivers, lakes). Just send me a note in the comments and I’ll get back to you to work out the logistics. Thanks.
Jim
Monthly Temperature and Precipitation Departures Since 2011 in Illinois
Here are the statewide Illinois monthly temperature and precipitation departures from the 1981-2010 average for both 2011 and 2012. We have had a run of above-average temperatures since October 2011 and a run of below-average precipitation since January of 2012. The latest outlooks published on June 30 by the National Weather Service shows that the odds of this pattern of warmer and drier conditions to prevail through July (bottom figure).


Dry Across the Midwest – 2012 Compared to 1988
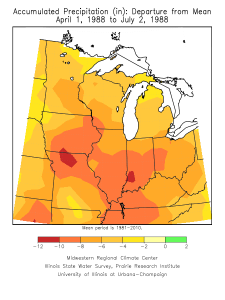
The current drought condition has many similarities with 1988. Here is the departure from normal precipitation for the Midwest from April 1 to July 2 for 2012 (left) and for 1988 (right).
Areas in green are doing well. Areas in blue are having to deal with flooding issues. Areas in yellow are dry, and areas in the darker shades of yellow, orange, and red are progressively drier.
This year the drought has missed parts of Minnesota, Wisconsin, and Michigan, where all the Midwestern states suffered in 1988. So far this year, the hardest hit area is in southern Illinois, southwest Indiana, western Kentucky and southeastern Missouri with departures of 8 to 12 inches (dark orange and red areas) since April 1. In 1988, those same conditions were seen over a wider area including large parts of northern Missouri, Iowa, Illinois, Indiana, western Kentucky, and eastern Ohio.


Grim News for Illinois Crops
The latest USDA Illinois Weather and Crops report was released this afternoon. The topsoil conditions were rated at 52 percent “very short” and 37 percent “short” and only 11 percent adequate. Soil moisture conditions were best in northern Illinois, and deteriorated southward. Hardest hit was southeastern Illinois with 100 percent of the topsoil and 100 percent of subsoil rated as “very short”.
The corn crop was rated at 12 percent “very poor” and 21 percent “poor”. The soybean crop was rated at 11 percent “very poor” and 20 percent “poor”.
Several people have compared this year to 1988. How bad was soil moisture in 1988? According to the USDA report for July 5, 1988, the entire state was listed as 100 percent “very short” on topsoil moisture. However, they rated the corn crop at 2 percent “very poor” and 20 percent “poor”. The soybean crop was rated as 2 percent “very poor” and 14 percent “poor”. So they rated the soil moisture to be in worse shape yet they rated the crop to be in better shape in 1988, compared to 2012. It’s hard to make sense of the numbers. Of course, these are subjective ratings and the procedure for rating crops and soils has likely changed with time.

